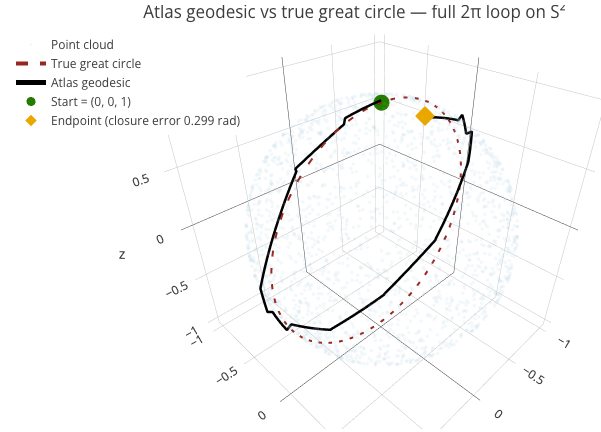
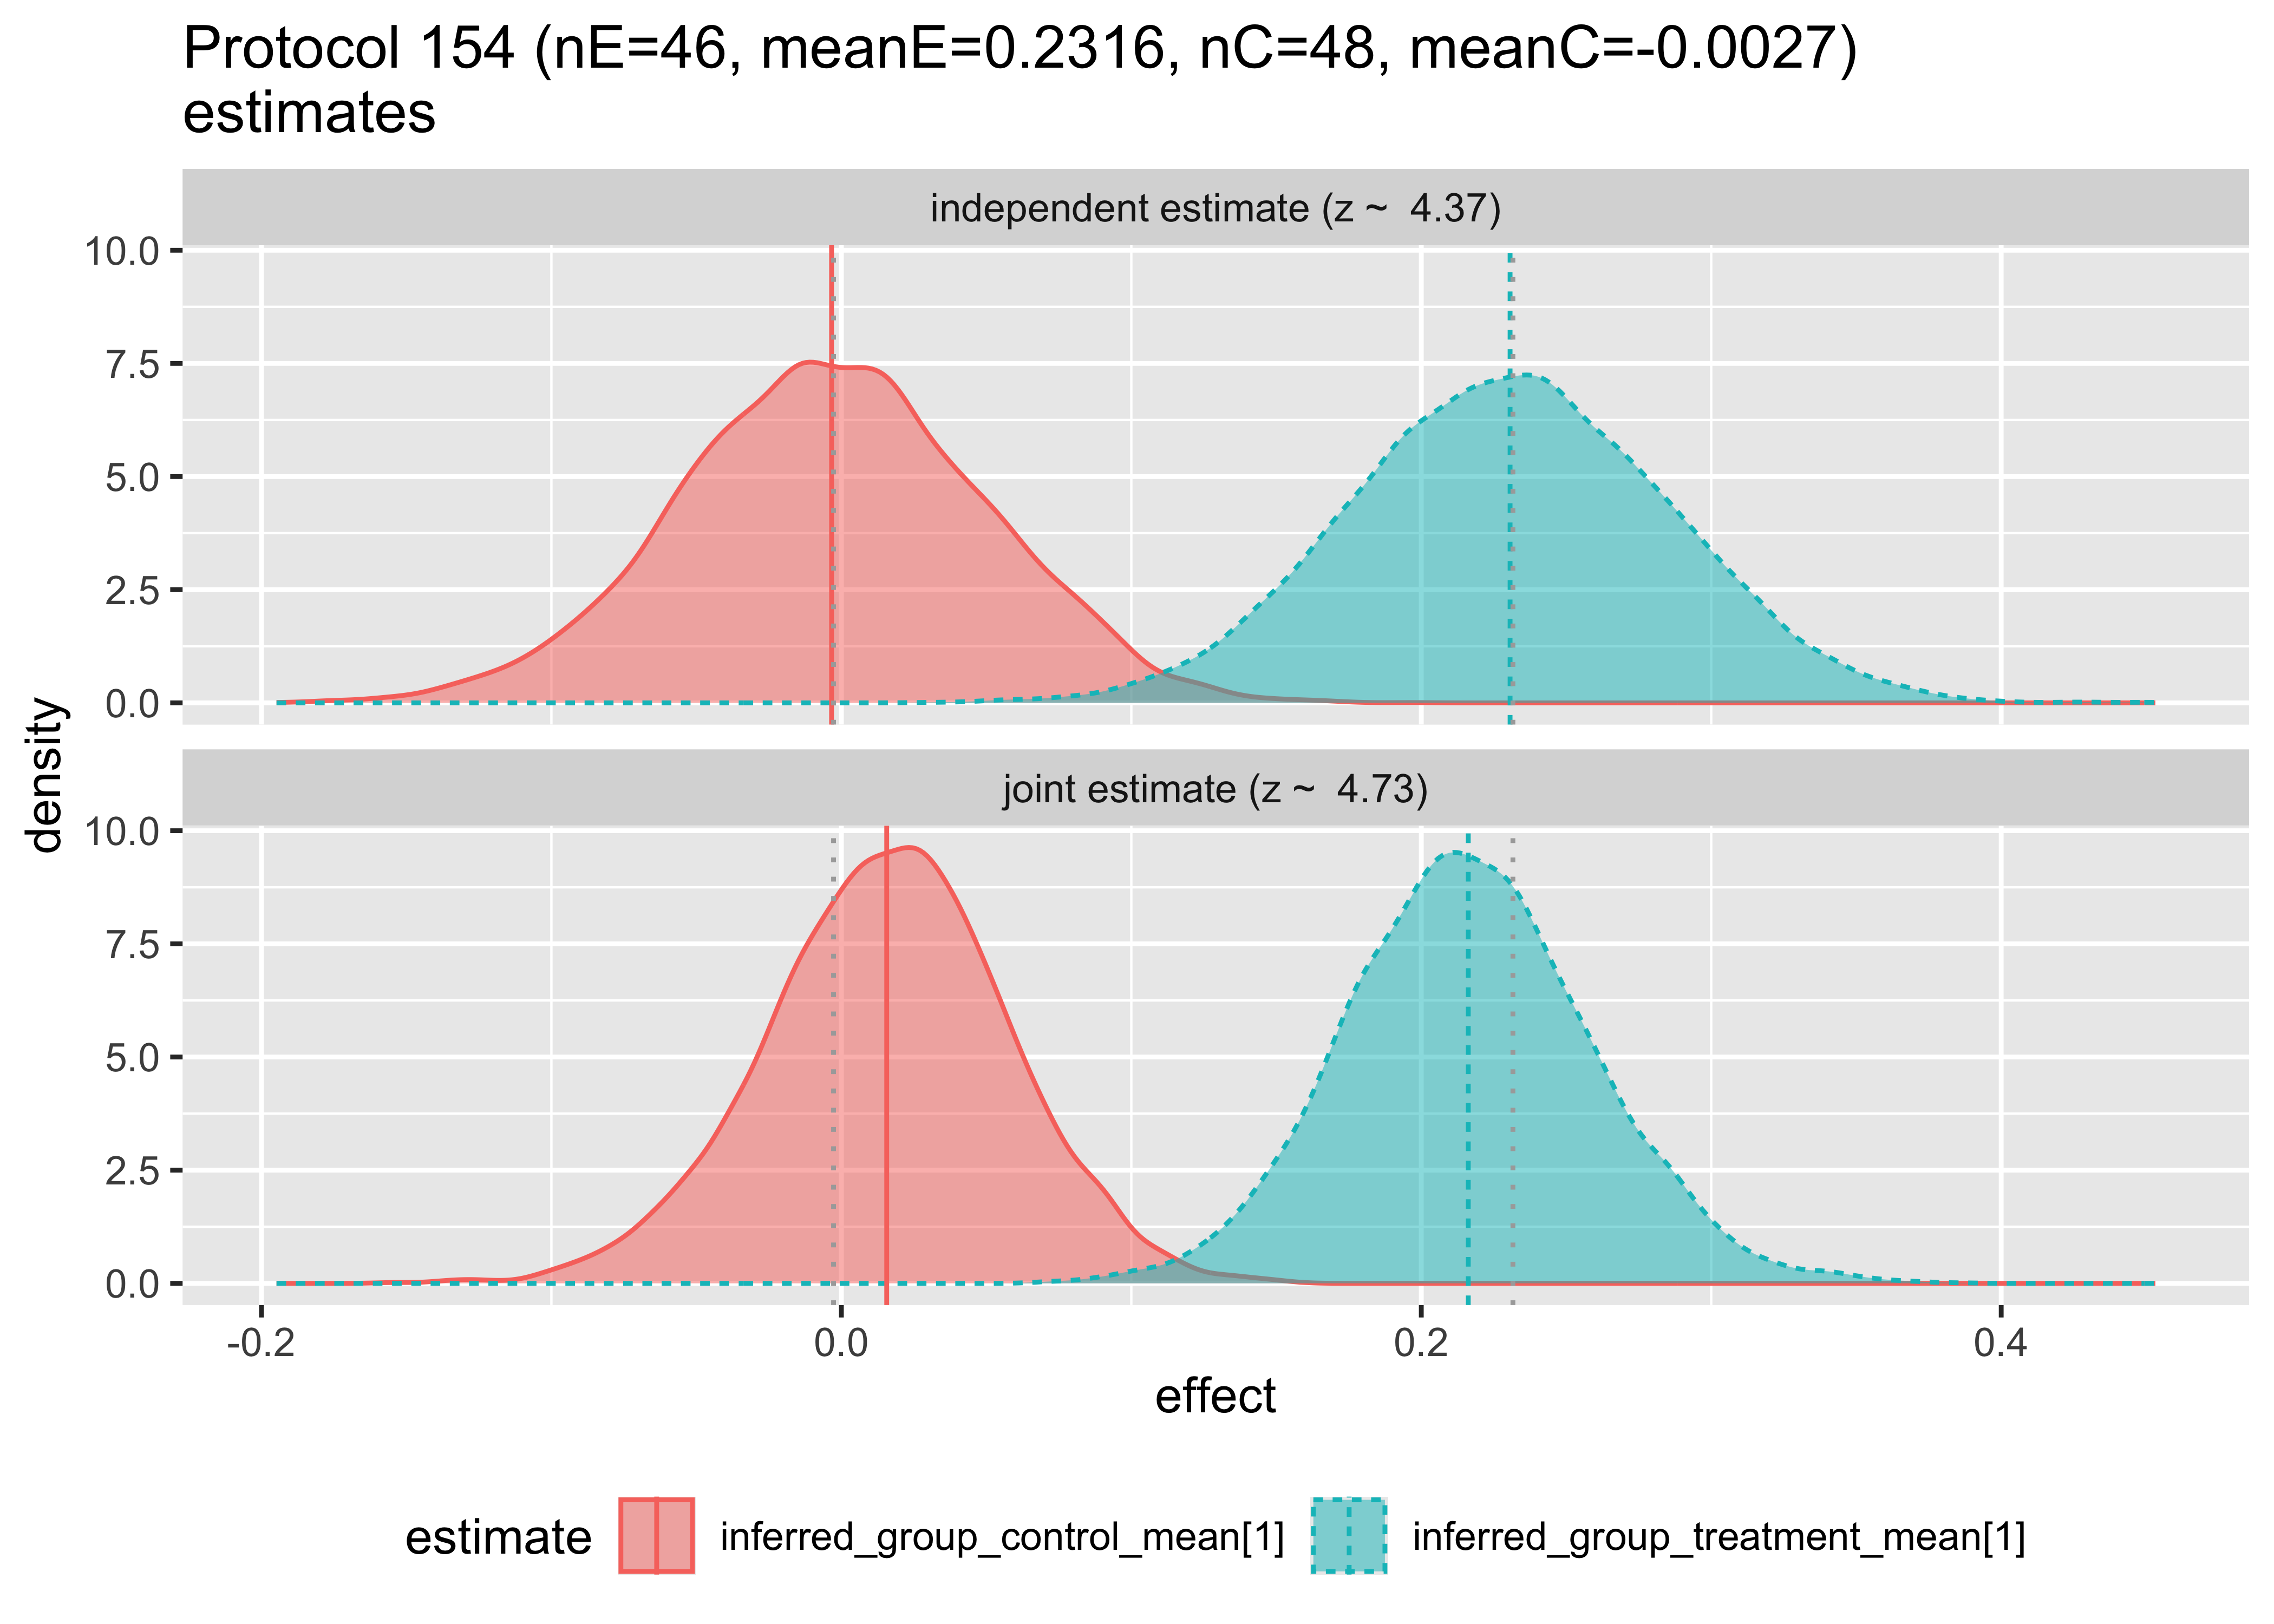
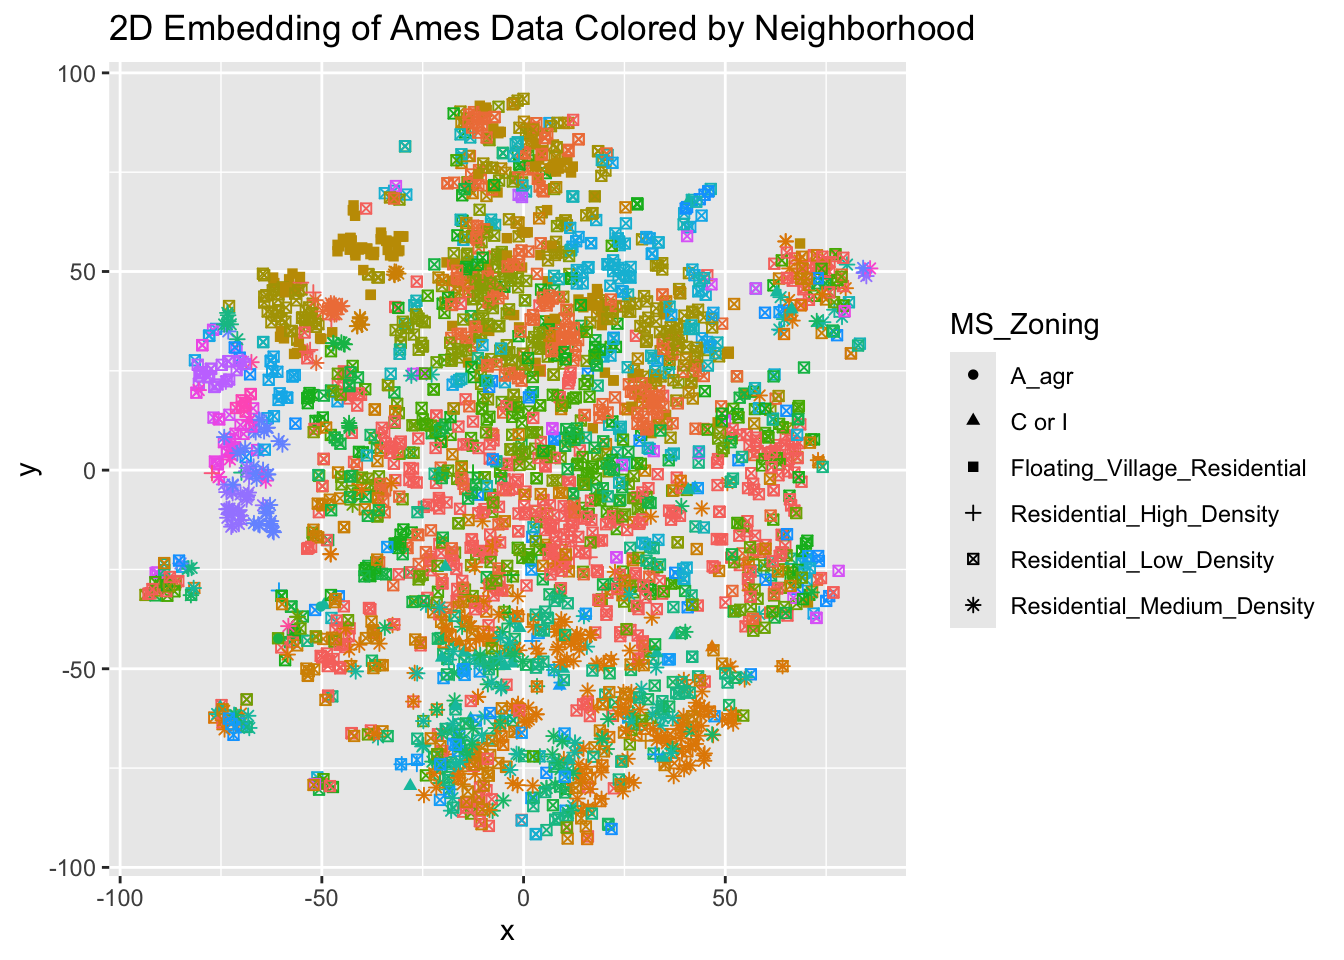
The Atlas-Learn Approach to the Manifold Hypothesis
Differential Geometry


Dyson’s Algorithm: The General Case
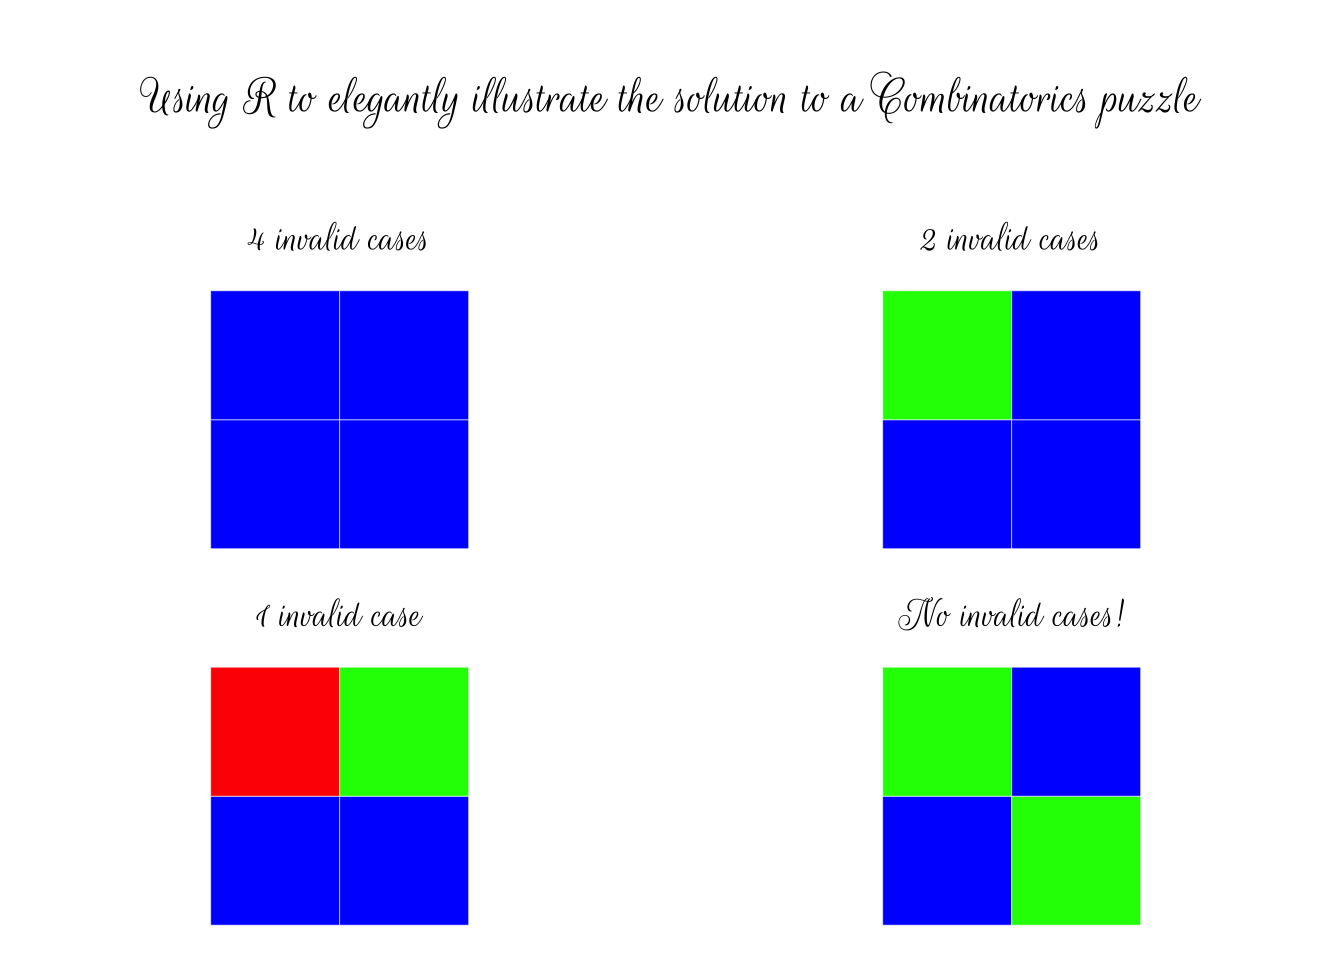
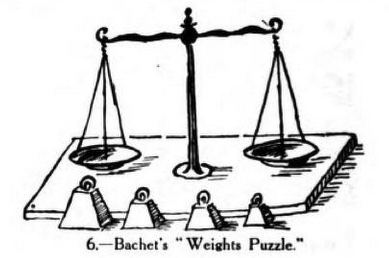
Puzzle Corner


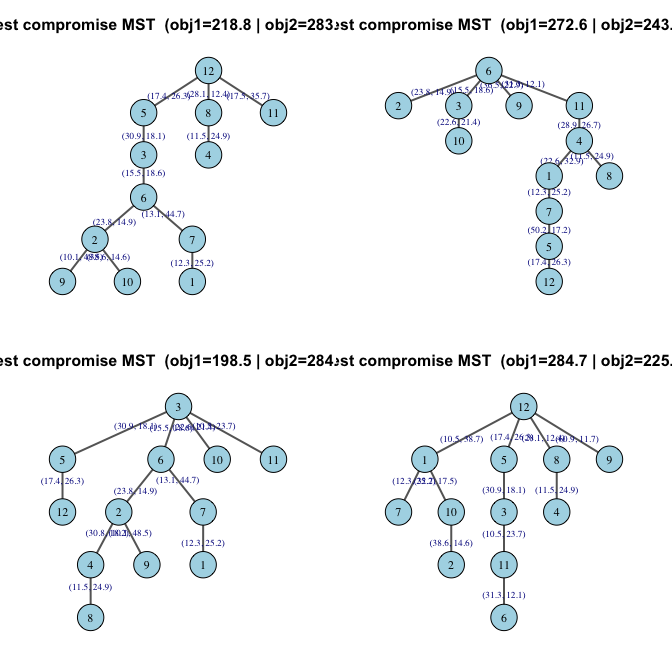
Dyson’s Algorithm for the Twelve Coins Problem
Puzzle Corner
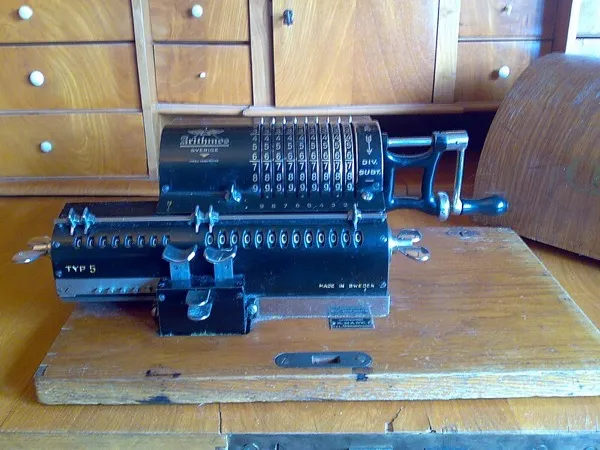
The Perplexed Banker
Puzzle Corner


No matching items