AI
btw v1.1.0: Implements a toolkit for connecting R environments with Large Language Models (LLMs). Provides utilities for describing R objects, package documentation, and workspace state in plain text formats optimized for LLM consumption. Supports multiple workflows: interactive copy-paste to external chat interfaces, programmatic tool registration with ellmer chat clients, batteries-included chat applications via shinychat, and exposure to external coding agents through the Model Context Protocol. Project configuration files enable stable, repeatable conversations with project-specific context and preferred LLM settings. See README.
Astronomy
marsrad v1.0.0: A set of functions to calculate solar irradiance and insolation on Mars horizontal and inclined surfaces. Based on NASA Technical Memoranda 102299, 103623, 105216, 106321, and 106700, i.e., the canonical Mars solar radiation papers. See README for examples.
Causal Inference
infocausality v1.0: Provides methods for quantifying temporal and spatial causality through information flow, and decomposing it into unique, redundant, and synergistic components, following the framework described in Martinez-Sanchez et al. (2024). See the vignette.
Data
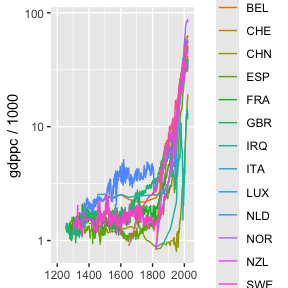
MaddisonData v1.0.2: Provides access to Maddison project data, which collates all the credible data on population and GDP for 169 countries. MaddisonLeaders makes it easy to find the leaders for each year, allowing users to exclude countries like OPEC with narrow economies to focus on the technology leaders. ggplotPath makes it easy to plot data for only selected countries or years. See the vignettes Industrial Revolution and Update Madison Data.
traktok v0.1.1: Provides functions for getting TikTok through the official and unofficial APIs—in other words, you can track TikTok. See the vignettes, research api and unofficial api.
Ecology
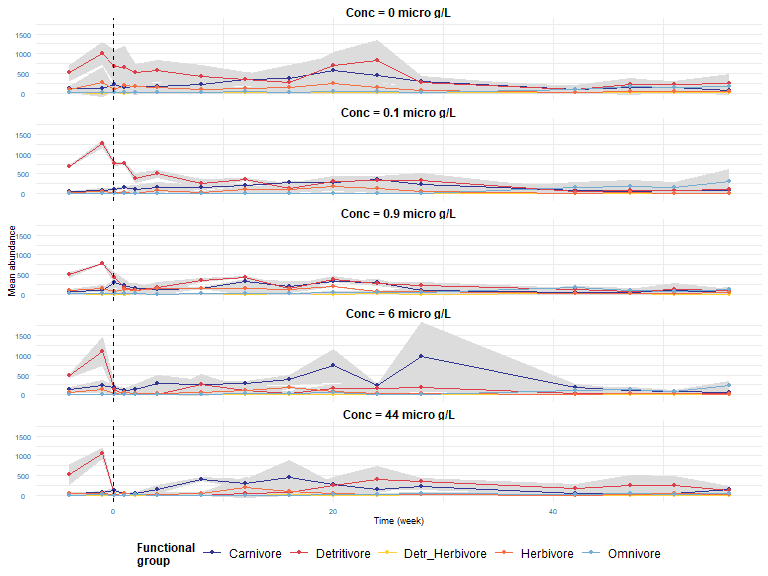
estar v1.0-1: Standardises established stability properties used to assess systems’ responses to press or pulse disturbances at different ecological levels (e.g. population, community). There are two sets of functions. The first set corresponds to functions that measure stability at any level of organisation. The second set of functions, when applied to Jacobian matrices, measure the stability of a community at short and long time scales. See Figueiredo et al. (2025) for the theory. There are two vignettes: Functional stability properties and Jacobian stability properties.
Epidemiology
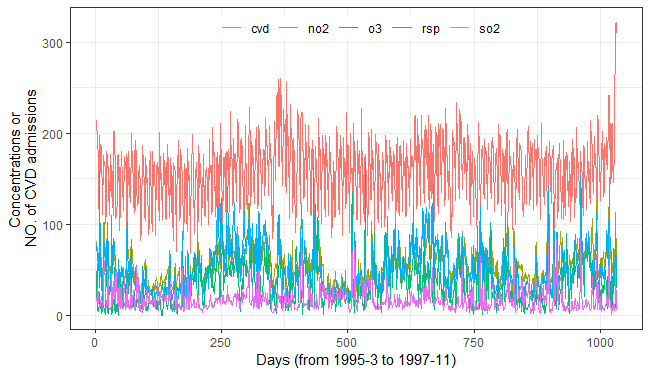
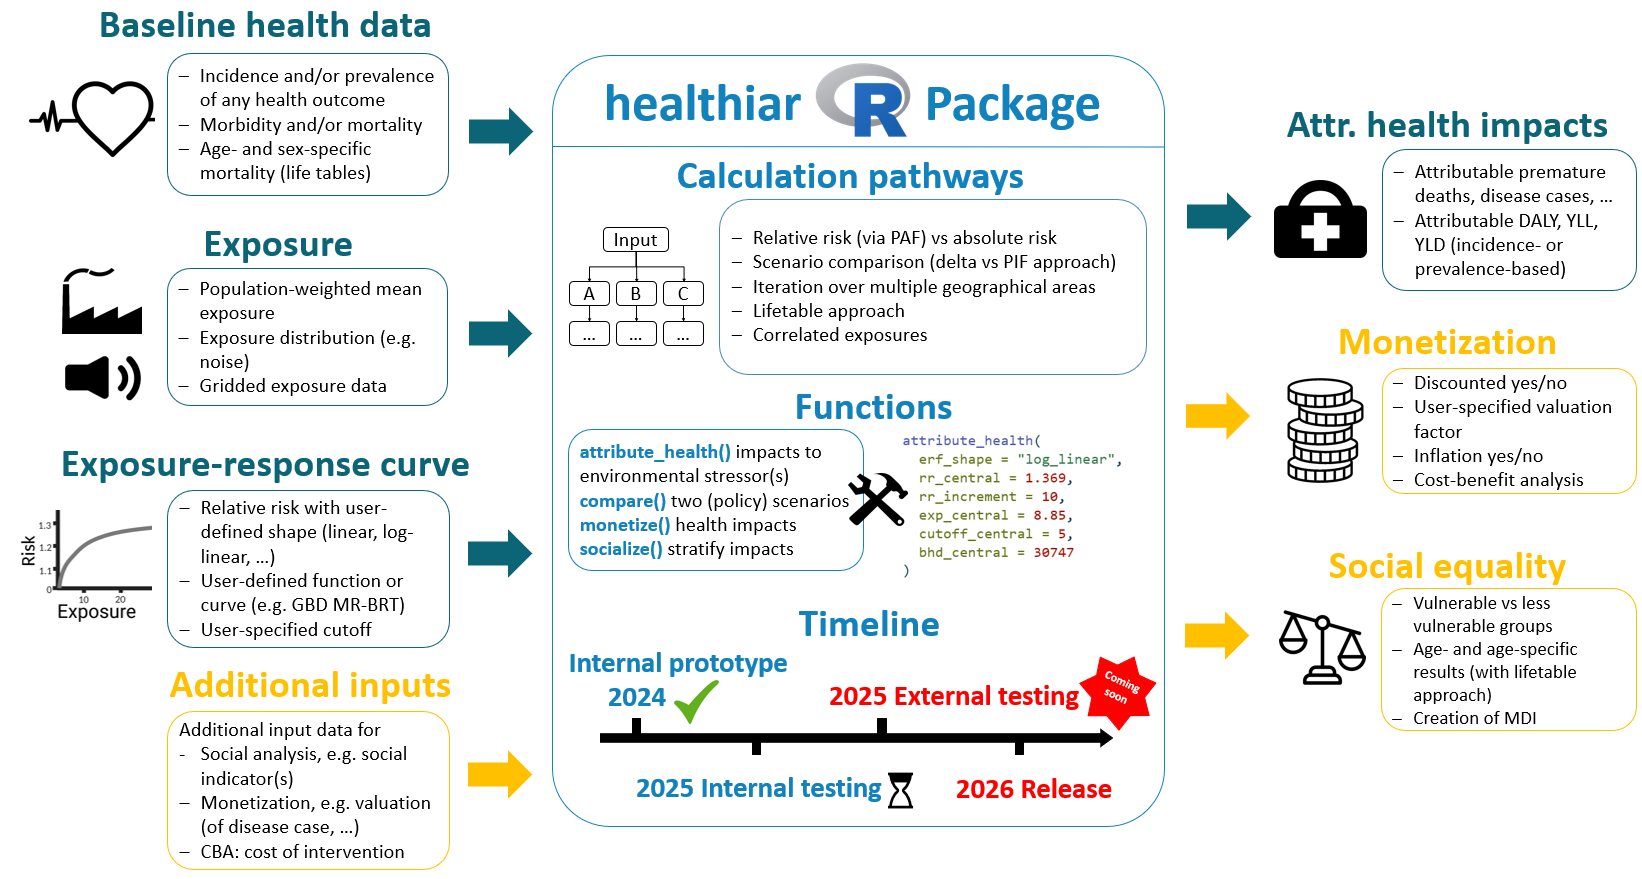
healthiar v0.2.1: Provides functions to quantify and monetize the health impacts of environmental stressors (air pollution & noise). See the document WHO (2003a): “Assessing the environmental burden of disease at national and local levels” for background and the vignette for examples.
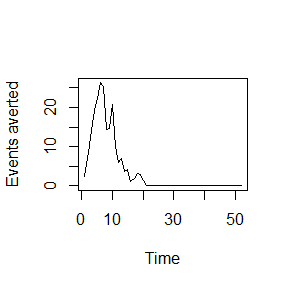
vaccinationimpact v0.1.0: Provides tools to estimate the impact of vaccination campaigns at population level (number of events averted, number of avertable events, number needed to vaccinate). Inspired by the methodology proposed by Foppa et al. (2015) and Machado et al. (2019) for influenza vaccination impact. See the vignette for examples.
Genomics
XYomics v0.1.2: Provides tools to analyze sex differences in omics data for complex diseases. It includes functions for differential expression analysis using the limma method as described in Ritchie et al. (2015), interaction testing between sex and disease, pathway enrichment with clusterProfiler Yu et al. (2012), and gene regulatory network construction and analysis using igraph. See the vignettes Bulk RNA-Seq Example and Single Cell Example.
Machine Learning
autotab v0.1.1: Provides tools to build and train a variational autoencoder (VAE) for mixed-type tabular data (continuous, binary, categorical). Models are implemented using TensorFlow and Keras via the reticulate interface, enabling reproducible VAE training for heterogeneous tabular datasets. See README to get started.
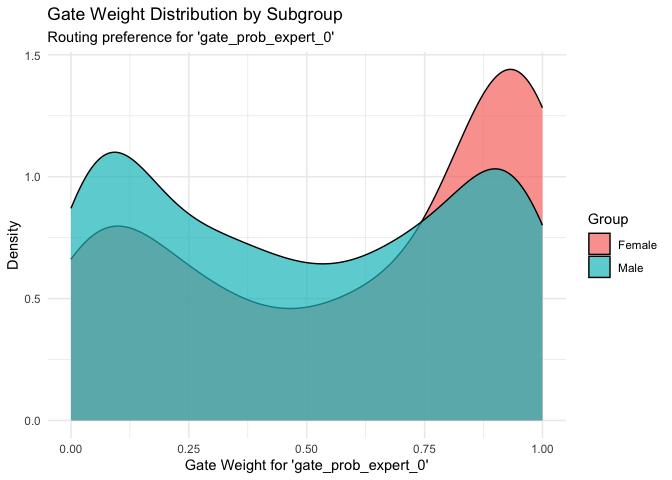
fairGATE v0.1.1: Provides tools for training and analysing fairness-aware gated neural networks for subgroup-aware prediction and interpretation in clinical datasets. Methods draw on prior work in mixture-of-experts neural networks by Jordan and Jacobs (1994), fairness-aware learning by Hardt, Price, and Srebro (2016), and personalised treatment prediction for depression by Iniesta, Stahl, and McGuffin (2016). See the vignette.
Marketing
rbranding v0.1.1: Implements a tool for building projects that are visually consistent, accessible, and easy to maintain. It provides functions for managing branding assets, applying organization-wide themes using brand.yml, and setting up new projects with accessibility features and correct branding, and supports quarto, shiny, and rmarkdown projects, and integrates with ggplot2. The accessibility features are based on the Web Content Accessibility Guidelines and Accessible Rich Internet Applications specifications. There are three vignettes including rebranding and Templates.
Medical Statistics
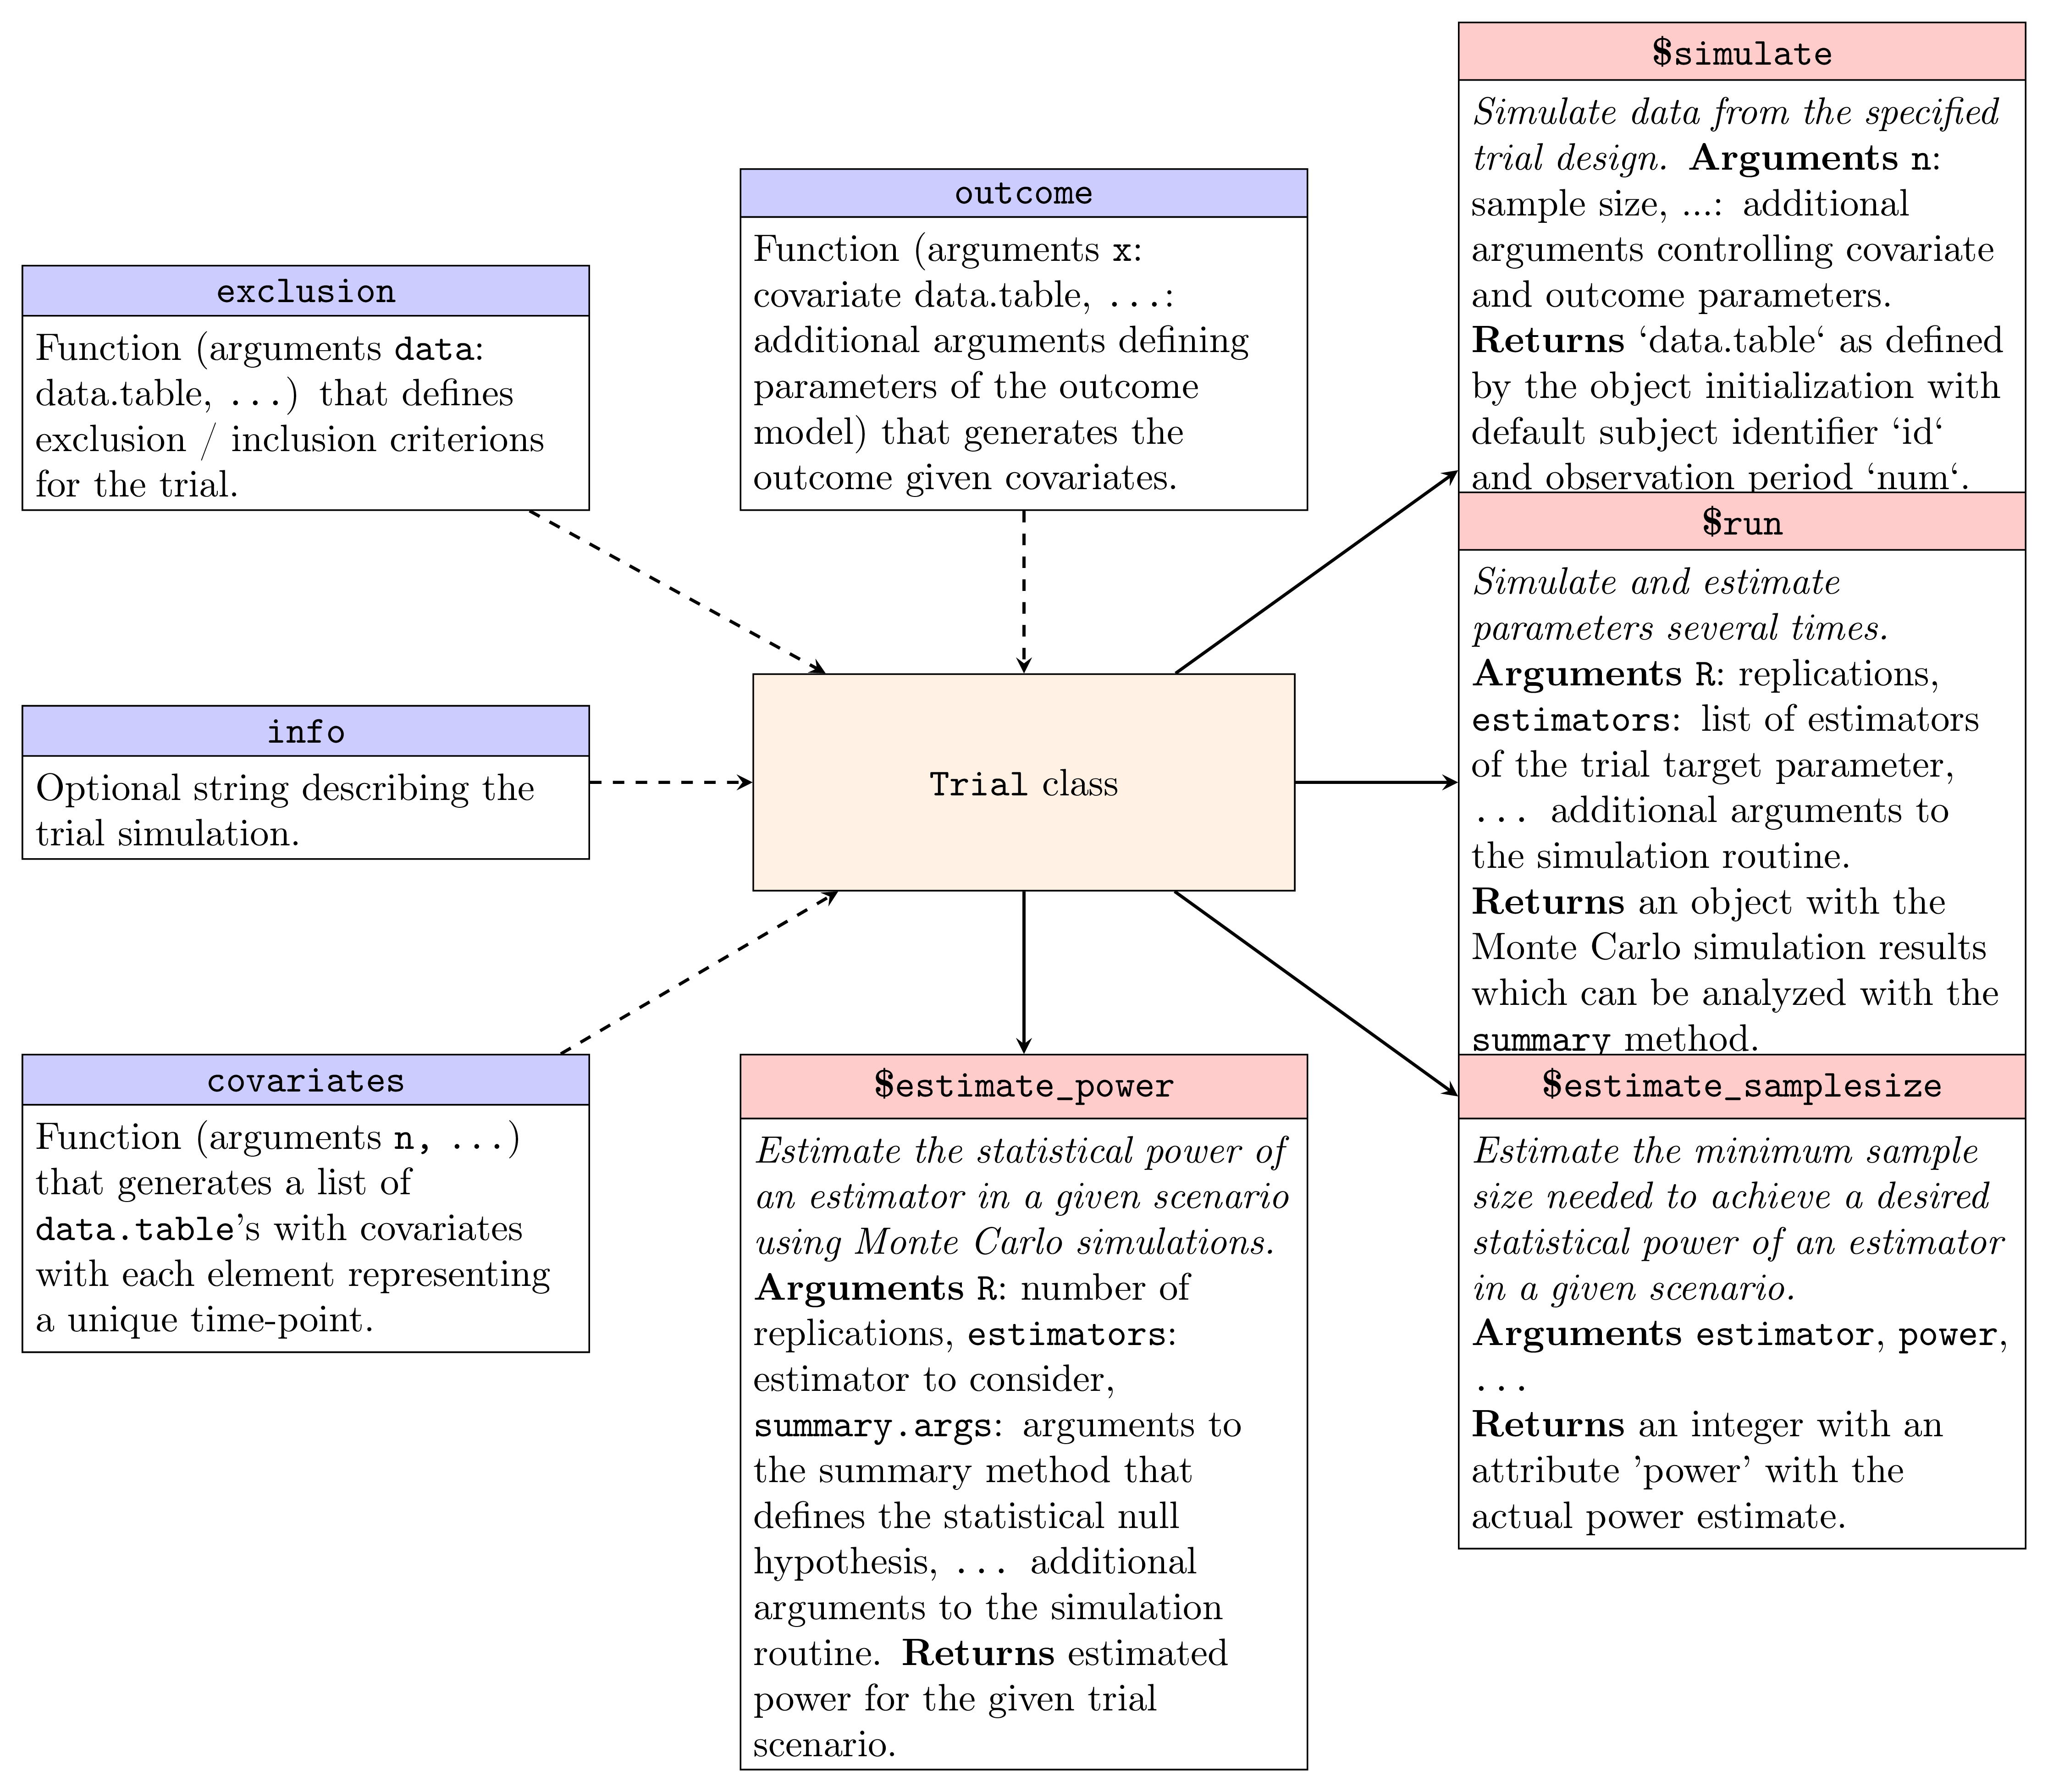
carts v0.1.0: Implements a Monte Carlo simulation framework for different randomized clinical trial designs with a special emphasis on estimators based on covariate adjustment. Functions include a regression-based covariate adjustment based on Rosenblum & van der Laan (2010) a one-step estimator based on Van Lancker et al (2024) for trials with continuous, binary and count outcomes and functions to estimate the minimum sample-size required to reach a specified statistical power for a given estimator, Robbins-Monro (1951). There are two vignettes Getting Started and Parametrization of the negative binomial and gamma distributions.
cgmguru v0.1.0: Provides tools for advanced analysis of continuous glucose monitoring (CGM) time-series, implementing GRID (Glucose Rate Increase Detector) and GRID-based algorithms for postprandial peak detection, and detection of hypoglycemic and hyperglycemic episodes (Levels 1/2/Extended) aligned with international consensus CGM metrics. There are ninteen vignetttes, including Complete CGM Analysis Workflow and detect all events.
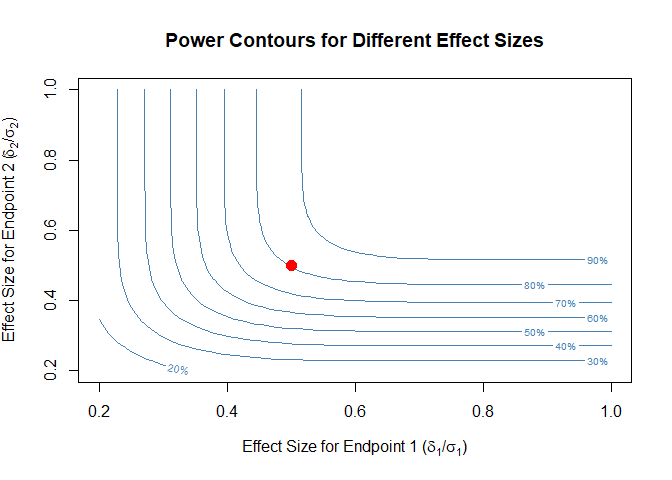
twoCoprimary v1.0.0: Provides functions to calculate sample size and power for clinical trials with two co-primary endpoints that support five endpoint combinations: two continuous endpoints (Sozu et al. (2011)), two binary endpoints using asymptotic methods (Sozu et al. (2010)) exact methods (Homma and Yoshida (2025)), mixed continuous and binary endpoints (Sozu et al. (2012)), and mixed count and continuous endpoints (Homma and Yoshida (2024)). There are six vignettes including an Overview and Mixed and Continuous Co-Primary Endpoints.
whatifbandit v0.3.0: Provides functions to simulate the results of completed randomized controlled trials, as if they had been conducted as adaptive Multi-Arm Bandit trials instead. Uses augmented inverse probability weighted estimation, outlined by Hadad et al. (2021), to estimate the probability of success for each treatment arm under the adaptive design. See Offer-Westort et al. (2021) for background and the vignette for examples.

Risk Analysis
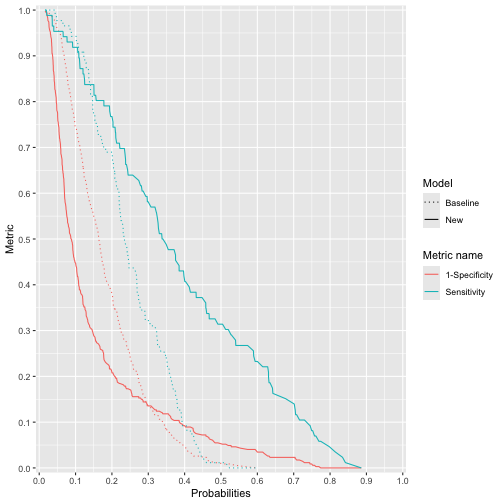
raptools v1.23.0: Provides tools for assessing the comparative performance of two logistic regression models or results of such models or classification models. Discrimination metrics include integrated discrimination improvement, net reclassification improvement, difference in area under curves, and Brier scores. Methods are described in Pencina et al. (2008). Look here for examples.
Shiny
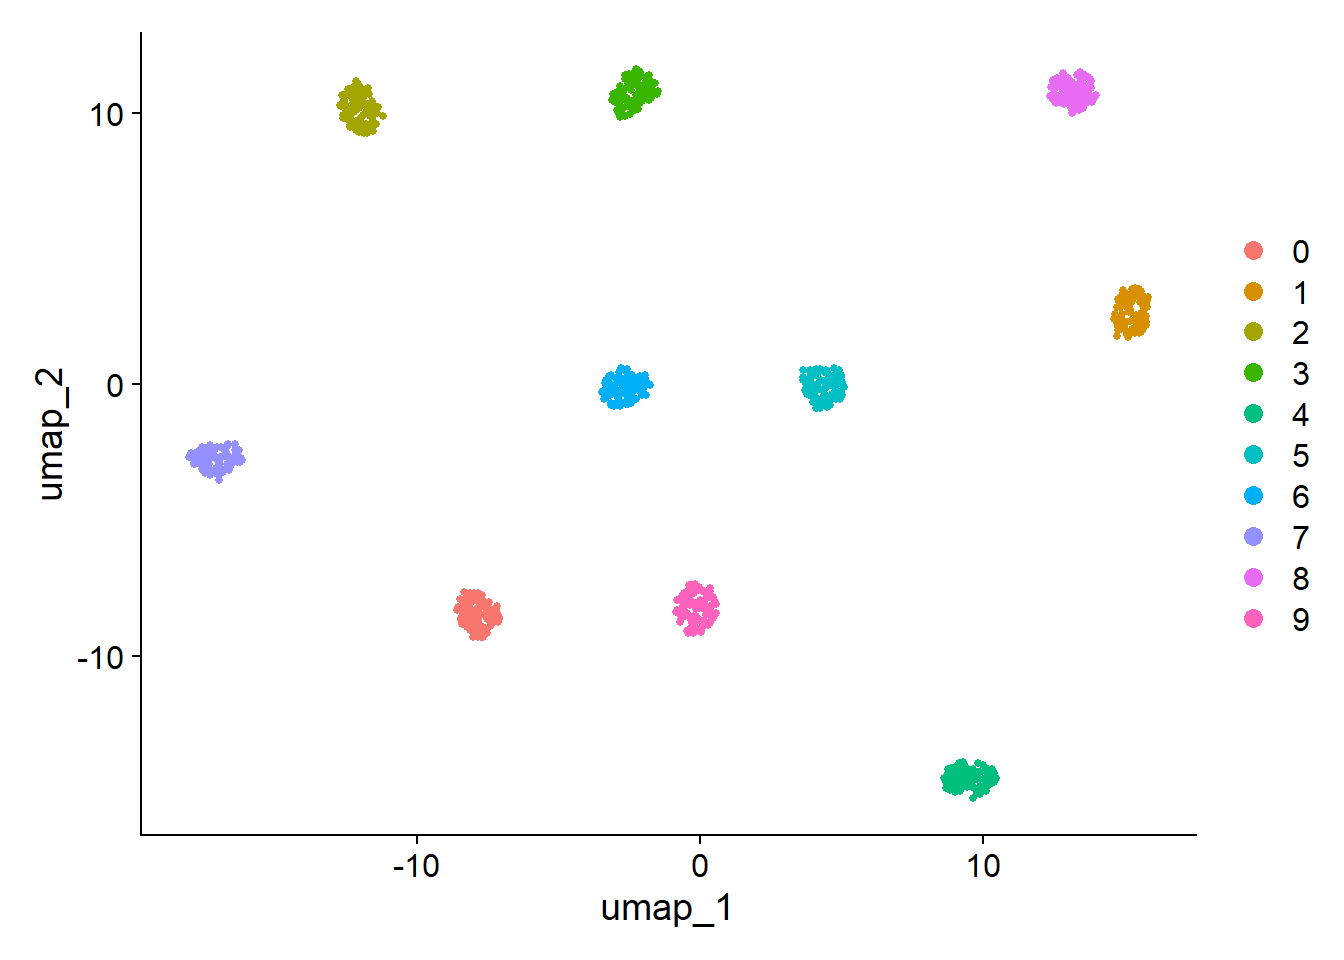
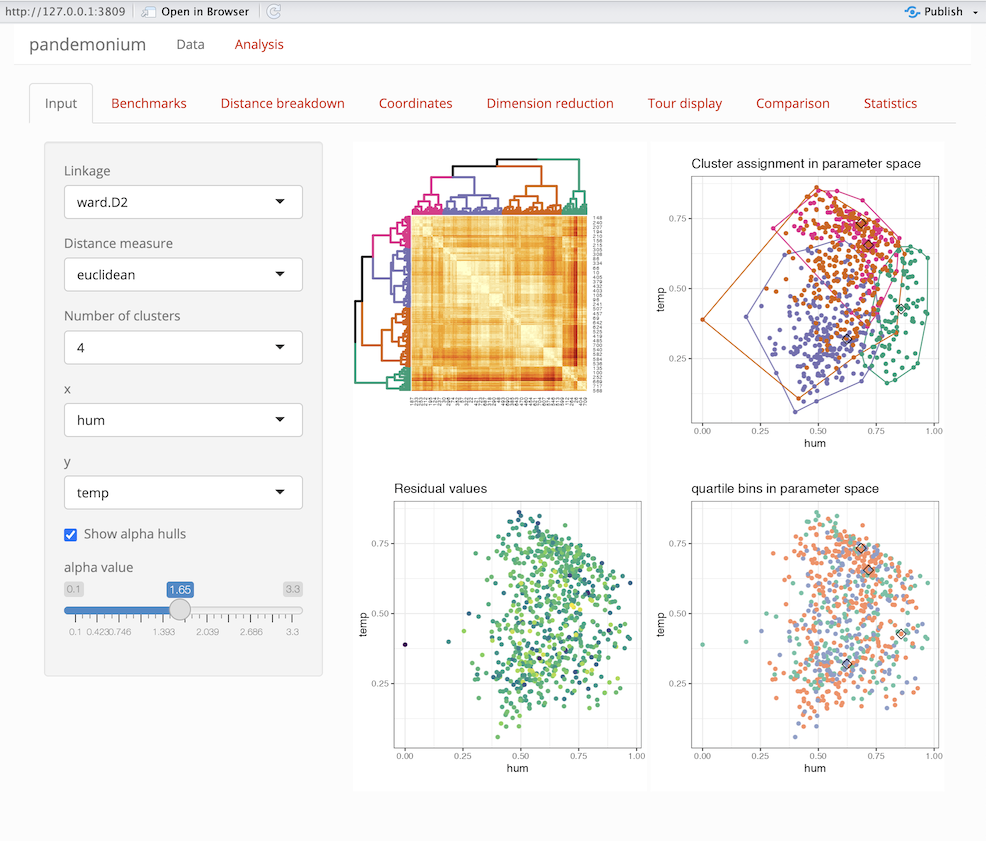
pandemonium v0.2.4: Implements a shiny GUI that performs high dimensional cluster analysis. This tool performs data preparation, clustering and visualisation within a dynamic GUI. With interactive methods allowing the user to change settings all without having to leave the GUI. See Laa and Valencia (2022) for background. There are seven vignettes, including Data Analysis and dimReduction.
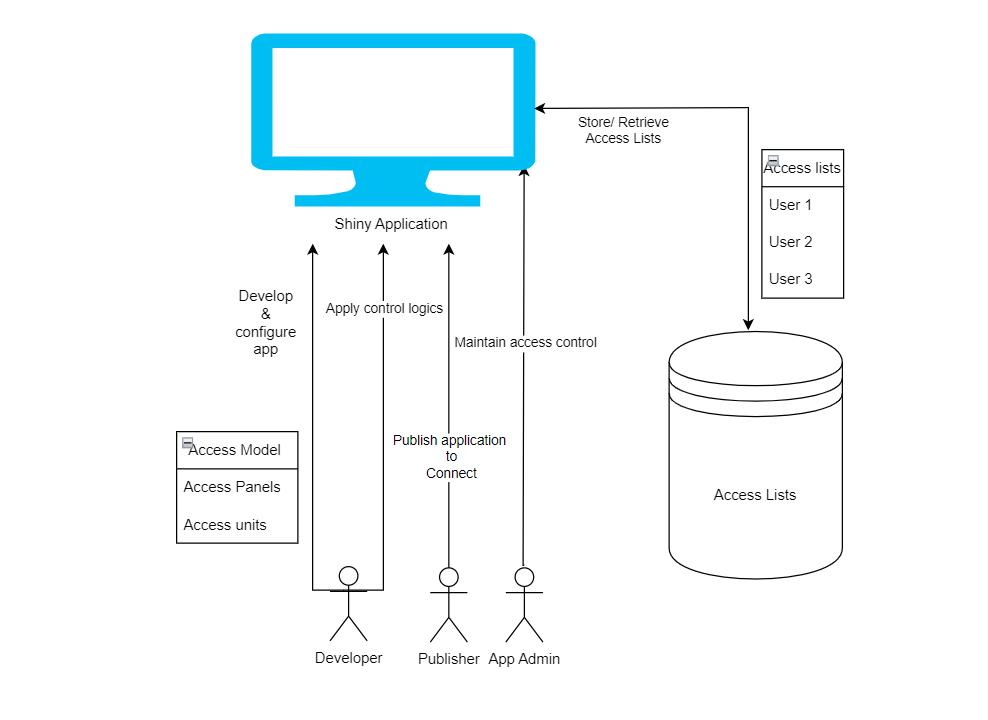
rAccess v0.1.1.3: Provides a framework for implementing hierarchical access control in shiny applications. Features include user permission management through a two-tier system of access panels and units, pluggable shiny module for administrative interfaces, and support for multiple storage backends (local, AWS S3, Posit Connect). The system enables fine-grained control over application features, with built-in audit trails and user management capabilities. See the Tutorial.
shinyOAuth v0.1.4: Provides a configurable, provider-agnostic OAuth 2.0 and OpenID Connect authentication framework for shiny applications using S7 classes. Defines providers, clients, and tokens, as well as various supporting functions and a shiny module. Features include cross-site request forgery protection, state encryption, Proof Key for Code Exchange handling, validation of OIDC identity tokens, automatic user info retrieval, asynchronous flows, and hooks for audit logging. There are four vignettes, including Usage and Example: Spotify login.
Statistics
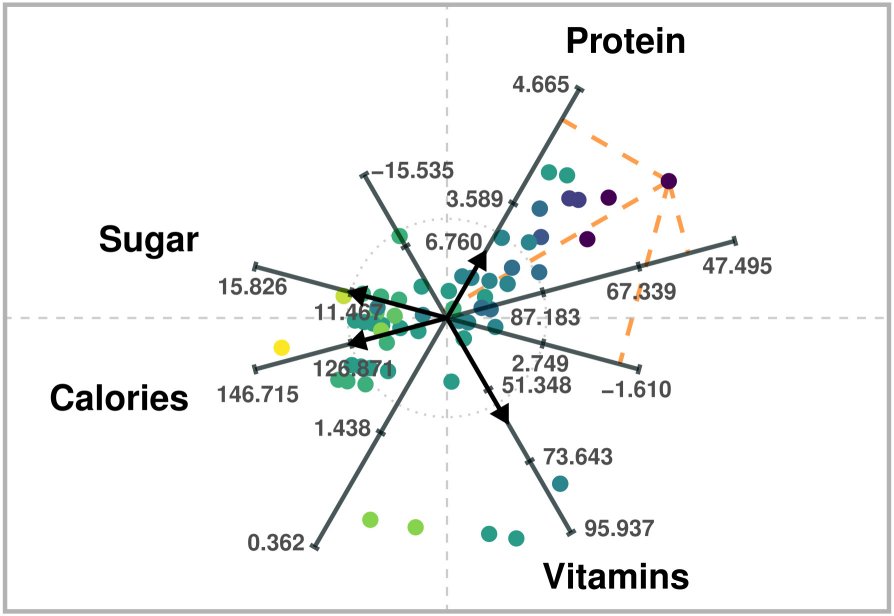
aramappings v0.1.2: Computes low-dimensional point representations of high-dimensional numerical data according to the data visualization method Adaptable Radial Axes described in: Rubio-Sánchez et al. (2017). See the vignette.
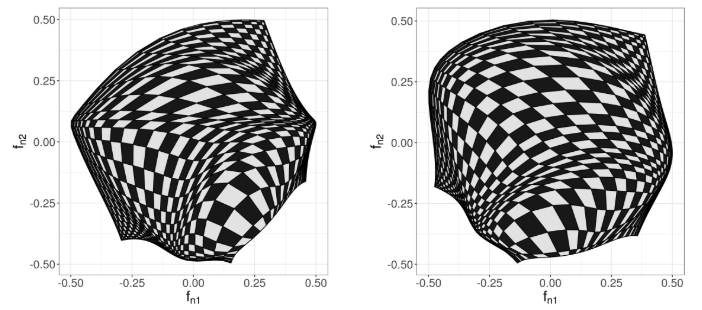
deepspat v0.3.1: Deep compositional spatial models are standard spatial covariance models coupled with an injective warping function of the spatial domain. The warping function is constructed through a composition of multiple elemental injective functions in a deep-learning framework. The package implements two cases for the univariate setting; first, when these warping functions are known up to some weights that need to be estimated, and, second, when the weights in each layer are random. Estimation and inference are done using tensorflow, which makes use of graphics processing units. For more details see Zammit-Mangion et al. (2022), Vu et al. (2022) and Shao et al. (2025). See README for an example.
fmi v0.1.7: Provides functions to test for functional measurement invariance between two groups. Implements hierarchical permutation tests for configural, metric, and scalar invariance, adapting concepts from multi-group confirmatory factor analysis to functional data. Methods are based on concepts from: Meredith, W. (1993), Yao et al. (2005) and Lee & Li (2022). See the vignette.
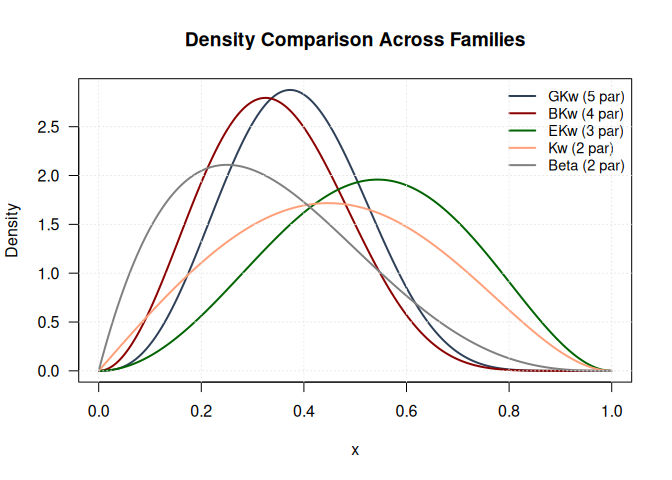
gkwdist v1.1.1: Implements the five-parameter Generalized Kumaraswamy distribution proposed by Carrasco, Ferrari and Cordeiro (2010) and its seven nested sub-families for modeling bounded continuous data on the unit interval (0,1). Provides density, distribution, quantile, and random generation functions, along with analytical log-likelihood, gradient, and Hessian functions. See the Introduction and the vignette on Statistical Properties.
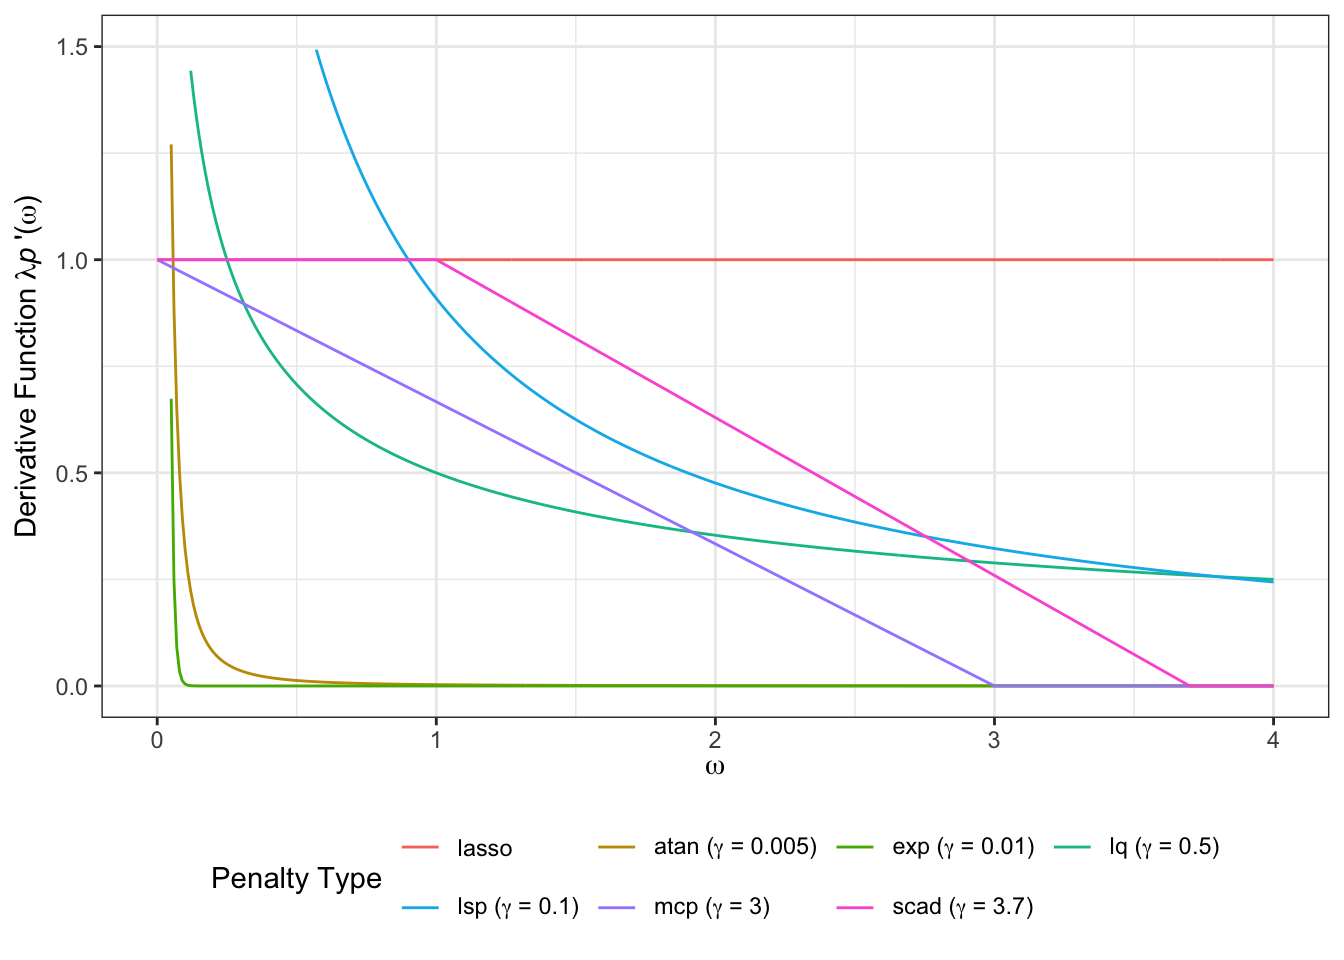
grasps v0.1.0: Provides a unified framework for sparse-group regularization and precision matrix estimation in Gaussian graphical models and implements multiple sparse-group penalties, including sparse-group lasso, sparse-group adaptive lasso, sparse-group SCAD, and sparse-group MCP. The package is designed for high-dimensional network inference where both sparsity and group structure are present. There are two vignettes: Selection Criteria and Penal Precision Matrix Estimation.
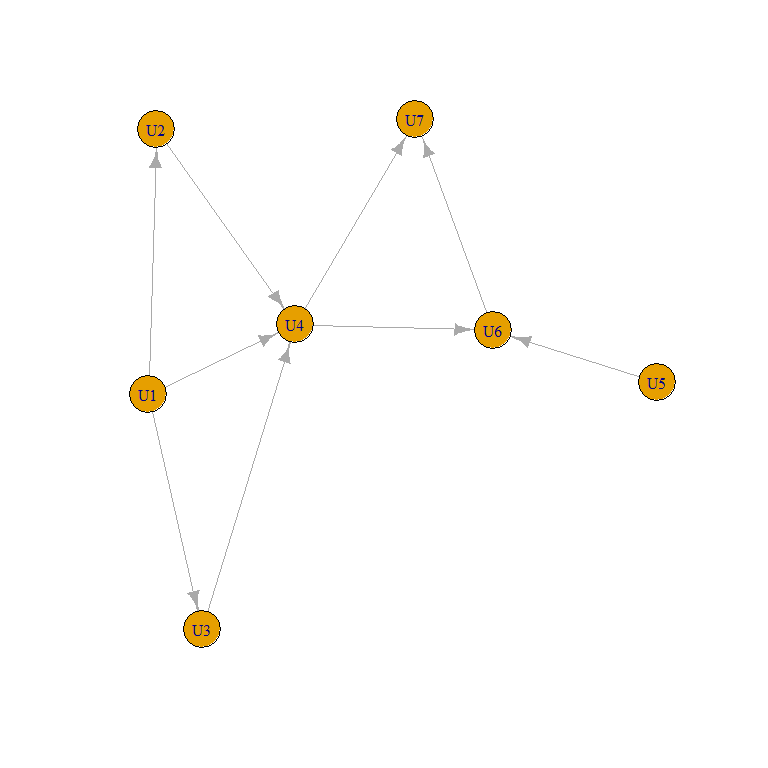
PCBN v0.1.1: Provides functions to create fit and sample Pair-Copula Bayesian networks (PCBN) under some restrictions on the underlying Directed Acyclic Graph (DAG), that is, no active cycles nor interfering v-structures. See Derumigny, Horsman and Kurowicka (2025) for background and the vignettes B-sets and interfering v-structures and How to use the estimation procedures.
PublicationBiasBenchmark v0.1.3: Implements a unified interface for benchmarking meta-analytic publication bias correction methods through simulation studies, which provide predefined data-generating mechanisms from the literature, functions for running meta-analytic methods on simulated data, pre-simulated datasets and pre-computed results for reproducible benchmarks, and tools for visualizing and comparing method performance. See Bartoš et al.(2025) for background. There seven vignettes, including Computing Method Measures and Adding New Methods.
SelectBoost.gamlss v0.2.2: Extends the SelectBoost approach to Generalized Additive Models for Location, Scale and Shape (GAMLSS). Implements bootstrap stability-selection across parameter-specific formulas (mu, sigma, nu, tau). Includes optional standardization of predictors and helper functions for corrected AIC calculation. See Bertrand and Maumy (2024) for details on correlation-aware resampling to improve variable selection for GAMLSS and quantile regression. There are nine vignettes including Advanced data examples and Confidence Functionals.
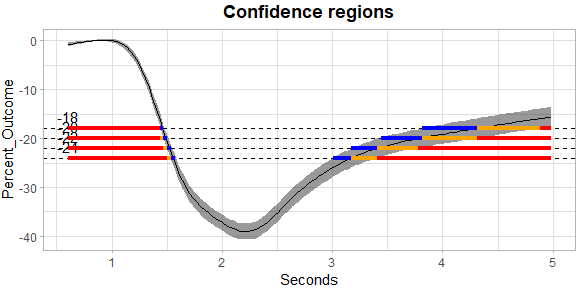
SCoRES v0.1.2: Provides computational tools for estimating inverse regions and constructing the corresponding simultaneous outer and inner confidence regions for logistic, functional, and spatial generalized least squares regression models. Functions are also available for constructing simultaneous confidence bands. See Sommerfeld et al. (2018) for the definition of a simultaneous confidence region, and see Ren et al. (2024), Crainiceanu et al. (2024), and Telschow et al. (2022) for background. There are four vignettes including Methods and Functional Data Example.
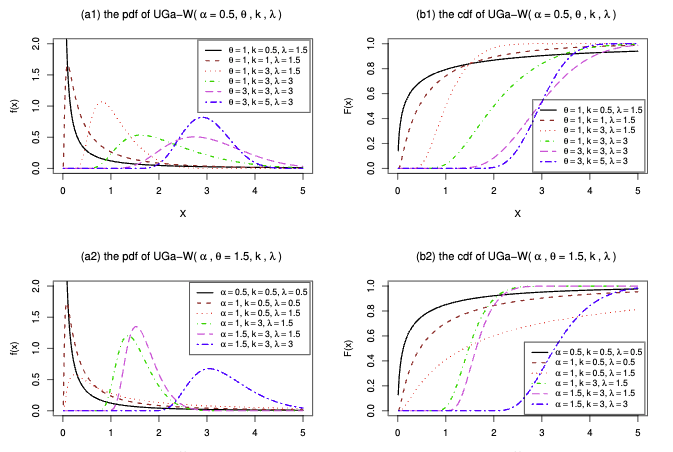
UGarima v0.1.0: Provides density, distribution function, quantile function, and random generating function of the Unit-Garima distribution based on Ayuyuen & Bodhisuwan (2024).
Time Series
aplms v0.1.0: Provides tools for fitting the additive partial linear models with symmetric autoregressive errors of order p, or APLMS-AR(p), enabling the modeling of a time series response variable using linear and nonlinear structures of a set of explanatory variables, with nonparametric components approximated by natural cubic splines or P-splines. Functions include various error distributions, such as normal, generalized normal, Student’s t, generalized Student’s t, power-exponential, and Cauchy distributions. Chou-Chen et al. (2024) for background. Look here for examples.
BLSloadR v0.2: Implements an interface for downloading data from the U.S. Bureau of Labor Statistics. Files include employment, unemployment, wages, prices, industry and occupational data at a national, state, and sub-state level, depending on the series. Individual functions are included for those programs that have data available at the state level. The core functions provide direct access to the Current Employment Statistics CES, Local Area Unemployment Statistics LAUS, Occupational Employment and Wage Statistics OEWS, and Alternative Measures of Labor Underutilization SALT. See the vignette.
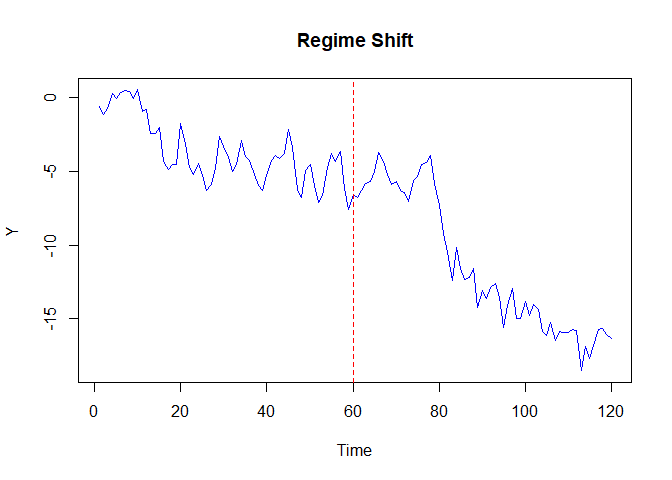
makicoint v1.0.0: Implements the Maki (2012) cointegration test that allows for an unknown number of structural breaks. The test detects cointegration relationships in the presence of up to five structural breaks in the intercept and/or slope coefficients. Four different model specifications are supported: level shifts, level shifts with trend, regime shifts, and trend with regime shifts. See the vignette.
organik v1.0.1: Provides functions to train per-horizon probabilistic ensembles from a univariate time series. It supports rpart, glmnet, and kNN engines with flexible residual distributions and heteroscedastic scale models, weighting variants by calibration-aware scores. A Gaussian/t copula couples the marginals to simulate joint forecast paths, returning quantiles, means, and step increments across horizons. Look here for the details.

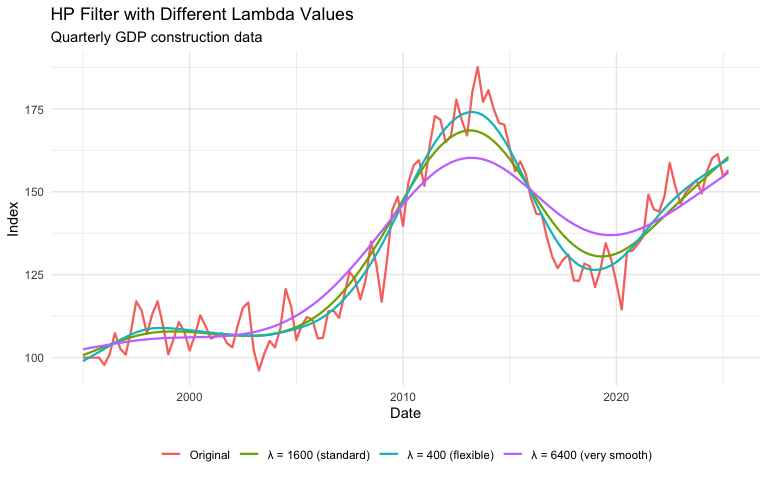
trendseries v1.1.0: Provides functions to extract trends from monthly and quarterly economic time series: augment_trends() for pipe-friendly tibble workflows and extract_trends() for direct time series analysis. Includes key econometric filters and modern parameter experimentation tools. There are three vignettes: Getting Started, Moving Averages, and Economic Filters for Business Cycle Analysis.
Utilities
hdf5lib v2.0.0.4: HDF5 (Hierarchical Data Format 5) is a high-performance library and file format for storing and managing large, complex data. This package, which provides the static libraries and headers for the HDF5 C library (release 2.0.0), is intended for developers to use in the LinkingTo field, which eliminates the need for users to install system-level dependencies. This build is compiled with thread-safety enabled and supports dynamic loading of external compression filters. Look here for more information.
privacyR v1.0.1: Provides tools for anonymizing sensitive patient and research data. Helps protect privacy while keeping data useful for analysis. Anonymizes IDs, names, dates, locations, and ages while maintaining referential integrity. Methods based on: Sweeney (2002), Dwork et al. (2006), El Emam et al. (2011), and Fung et al. (2010). See the vignette.
Visualization
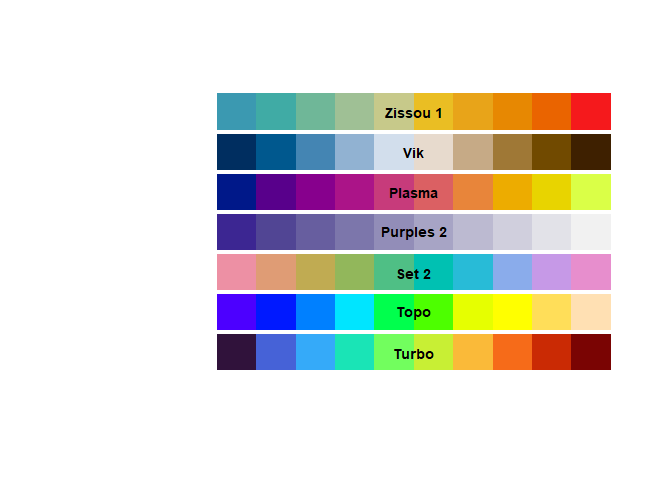
colorify v0.1.2: Provides one-stop shop for intuitive and dependency-free color and palette creation and modification. Includes palettes and functionality from popular packages such as viridis, RColorBrewer, and base R grDevices, as well as ggplot2 plot bindings. Users can generate perceptually uniform and colorblind-friendly palettes, adjust palettes in HSL and RGB color spaces, map color gradients to value ranges, and create color-generating functions. See the vignette.
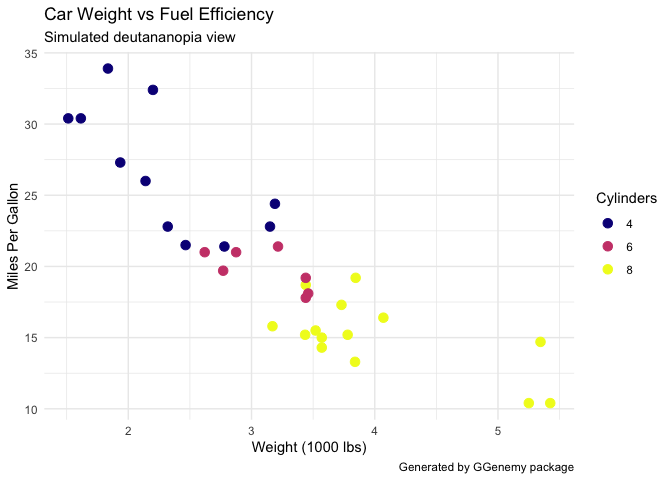
GGenemy v0.1.0: Audits ggplot2 visualizations for accessibility issues, misleading practices, and readability problems. Checks for color accessibility concerns, including colorblind-unfriendly palettes, misleading scale manipulations such as truncated axes and dual y-axes, text readability issues like small fonts and overlapping labels, and general accessibility barriers. Provides comprehensive audit reports with actionable suggestions for improvement. Color vision deficiency simulation uses methods from the colorspace package Zeileis et al. (2020) doi:10.18637/jss.v096.i01. Contrast calculations follow WCAG 2.1 guidelines (W3C 2018). See the vignette.
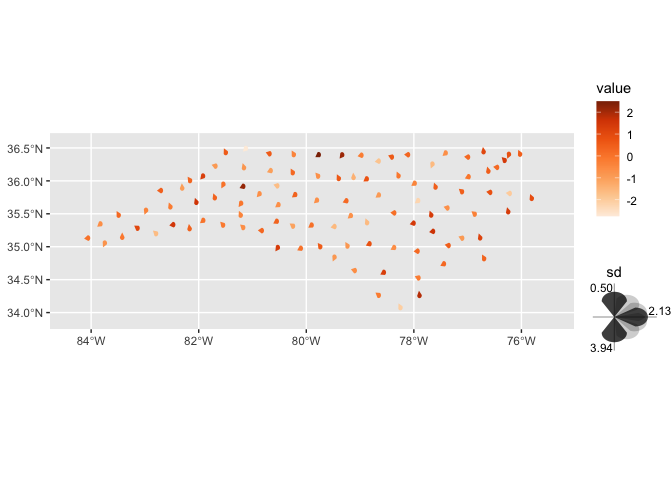
ggincerta v0.1.0: Extends ggplot2 with Layers and Scales for Spatial Uncertainty Visualization. See README.
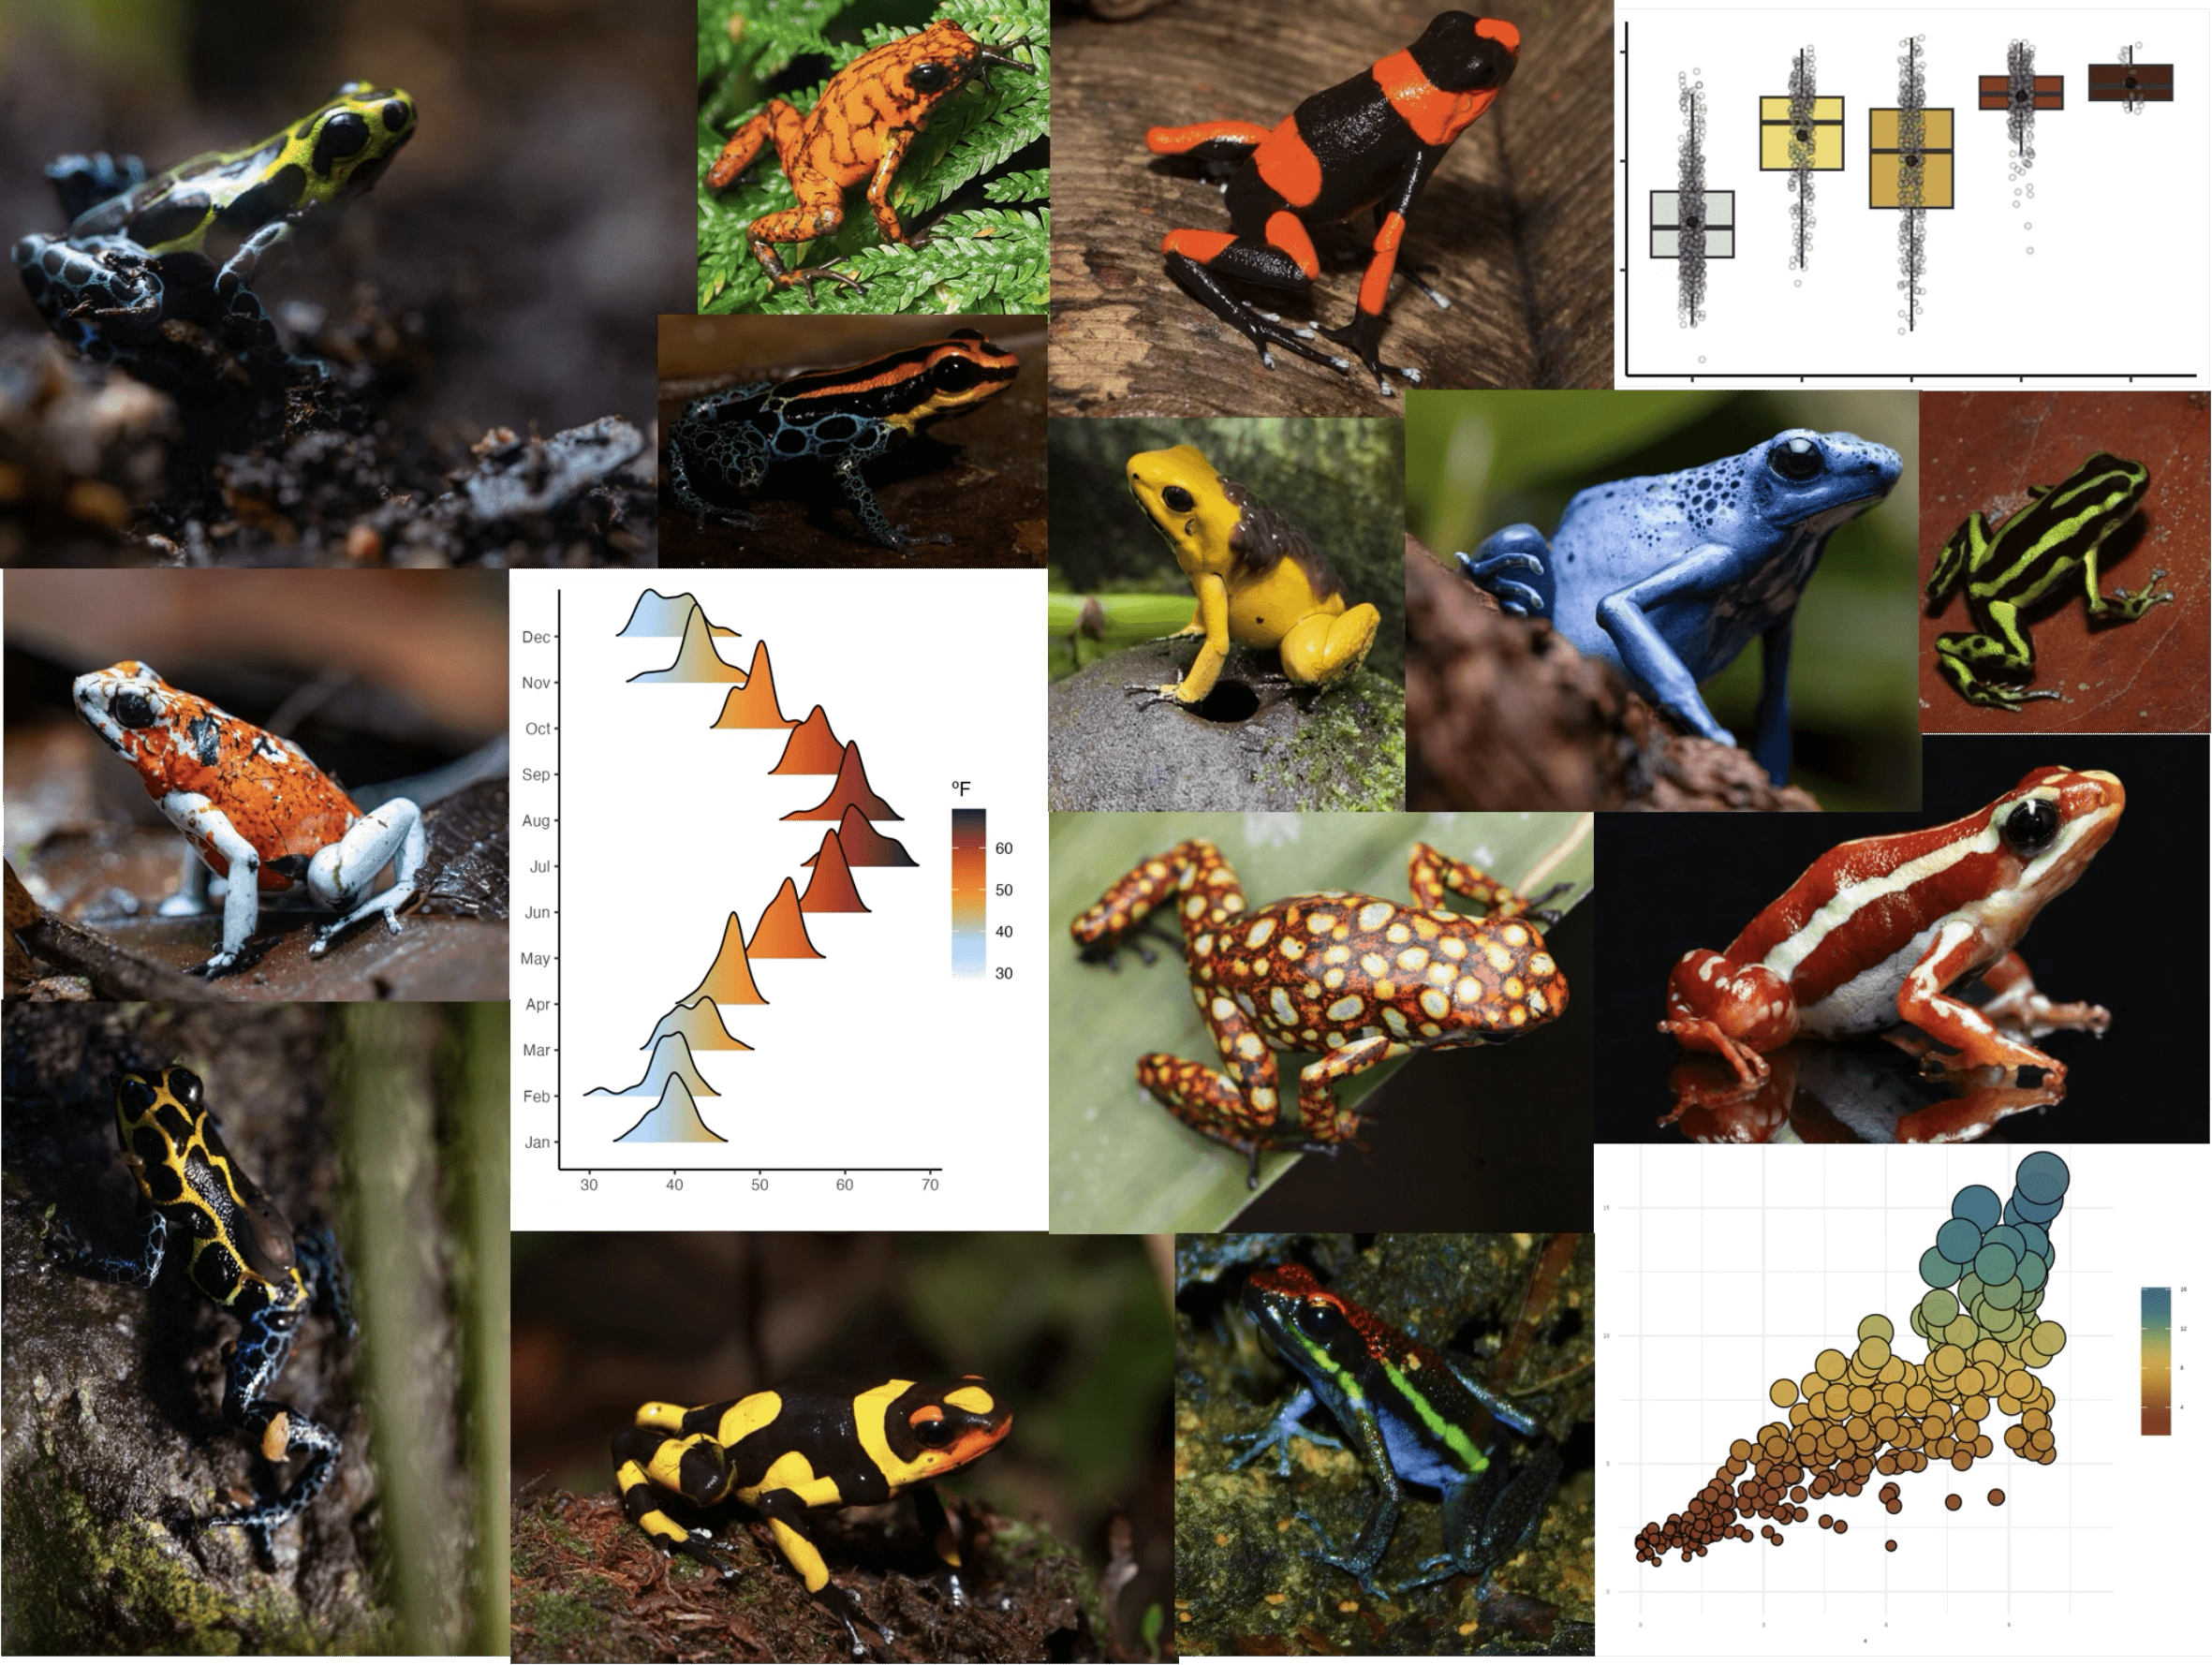
poisonfrogs v1.0.2: Provides a collection of color palettes inspired by the enormous diversity of skin colors in Neotropical poison frog species. Suitable for use with ggplot2 and base R graphics. See README.