Three hundred seventy-one of the new packages submitted to CRAN in March were still there in mid-April. Here are my Top 40 picks in fifteen categories: Causal Inference, Computational Methods, Data, Ecology, Health Technology Assessment, Mathematics, Medical Statistics, Probability Programming, Public Health, Risk Analysis, Statistics, Time Series, Utilities, and Visualization.
Causal Inference
causaldef v0.2.0: Implements Le Cam deficiency theory for causal inference, as described in Akdemir (2026). Provides theorem-backed bounds together with computable proxy diagnostics for information loss from confounding, selection bias, and distributional shift. Supports continuous, binary, count, survival, and competing risks outcomes. Key features include propensity-score total-variation deficiency proxies, negative control diagnostics, policy regret bounds, and sensitivity analysis via confounding frontiers. There are eleven vignettes including Introduction and Survival Analysis.
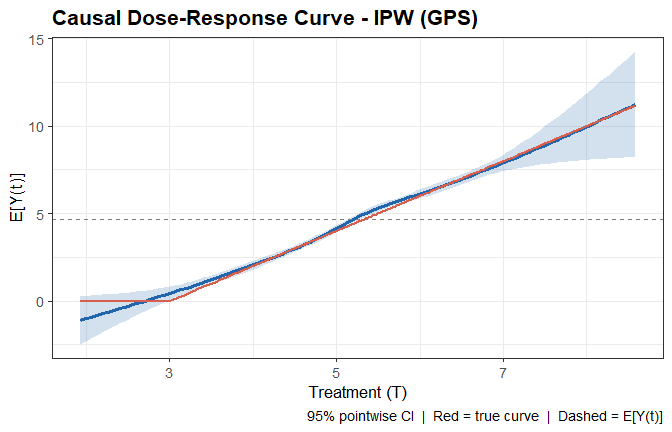
CausalSpline v0.1.0: Estimates nonlinear causal dose-response functions for continuous treatments using spline-based methods under standard causal assumptions (unconfoundedness / ignorability). Implements three identification strategies: inverse probability weighting via the generalized propensity score, G-computation (outcome regression), and a doubly-robust combination. Supports both natural cubic splines and B-splines and provides pointwise confidence bands and fragility diagnostics. See Hirano and Imbens (2004) for background and the vignette for examples.
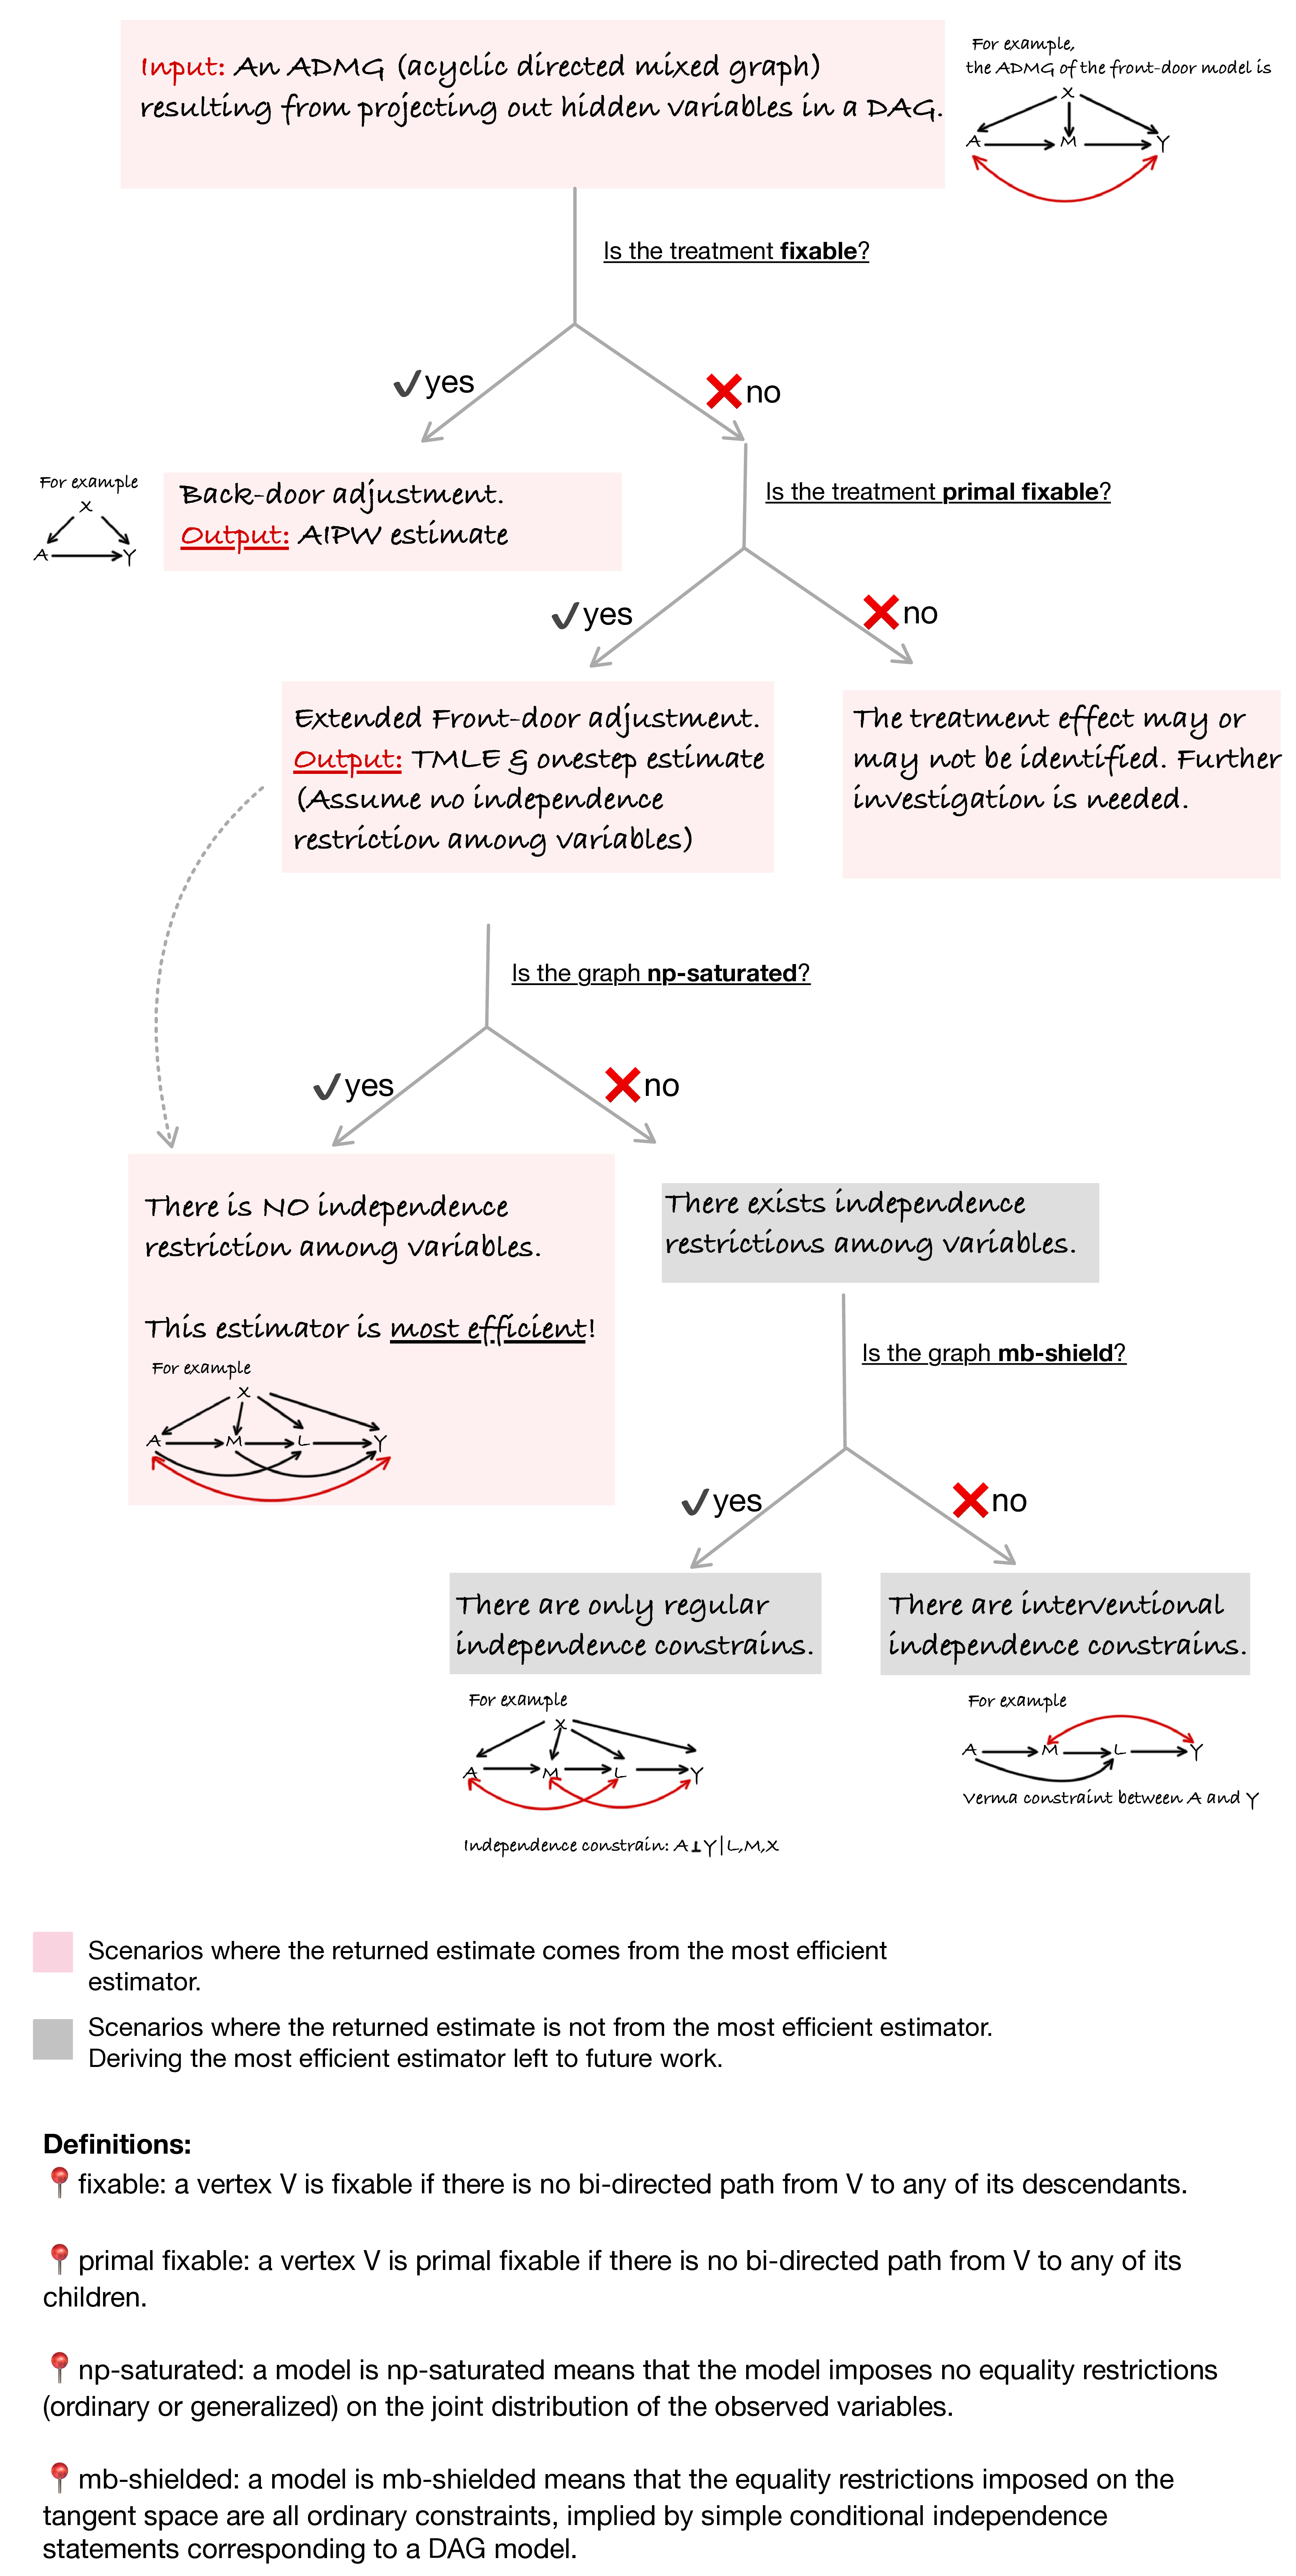
flexCausal v0.1.0: Provides doubly robust one-step and targeted maximum likelihood estimators for average causal effects in acyclic directed mixed graphs with unmeasured variables. Automatically determines whether the treatment effect is identified via backdoor adjustment or the extended front-door functional, and dispatches to the appropriate estimator. Supports incorporation of machine learning algorithms via SuperLearner and cross-fitting for nuisance estimation. Methods are described in Guo and Nabi (2024). See the vignette.
Computational Methods
opensimplex2 v0.0.3: Provides a function to generate 2, 3, or 4-dimensional gradient noise. The noise function is comparable to classic Perlin noise, but with less directional artefacts and lower computational overhead. It can have applications in procedural generation or flow field simulations. See the vignette.

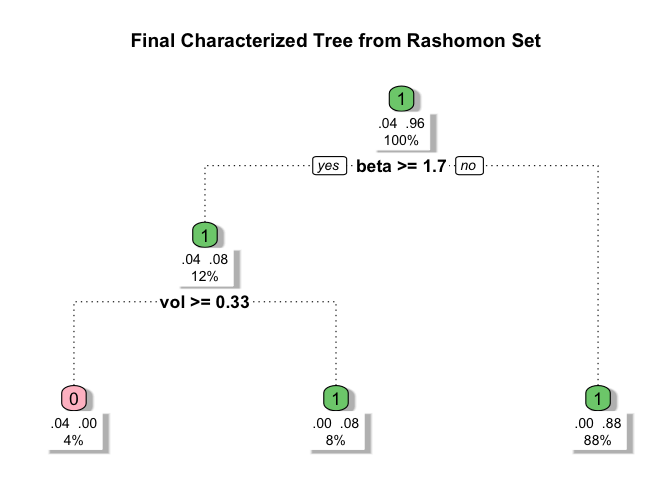
ROOT v0.1.1: Implements a general framework for globally optimizing user-specified objective functionals over interpretable binary weight functions represented as sparse decision trees, called ROOT (Rashomon Set of Optimal Trees). It searches over candidate trees to construct a Rashomon set of near-optimal solutions and derives a summary tree highlighting stable patterns in the optimized weights. ROOT includes a built-in generalizability mode for identifying subgroups in trial settings for transportability analyses Parikh et al. (2025). There are three vignettes including Quickstart Guide and Optimization Path Example.
Data
edgarfundamentals v0.1.2: Provides a simple, ticker-based interface for retrieving fundamental financial data from the United States Securities and Exchange Commission’s EDGAR XBRL API. Functions return key financial ratios including earnings per share, return on equity, return on assets, debt-to-equity, current ratio, gross margin, operating margin, net margin, price-to-earnings, price-to-book, and dividend yield for any publicly traded U.S. company. Data is sourced directly from company 10-K annual filings, requiring no API key or paid subscription. Designed for use in quantitative finance courses and research workflows. See the vignette.
fred v0.2.0: Provides tidy access to economic data from the Federal Reserve Economic Data (FRED) API which is maintained by the Federal Reserve Bank of St. Louis and contains over 800,000 time series from 118 sources covering GDP, employment, inflation, interest rates, trade, and more. Functions include fetching series observations, search for series, browse categories, releases, and tags, and retrieve series metadata. Real-time and vintage helpers built on ALFRED return a series as it appeared on a given date, the first-release version, every revision, or a panel of selected vintages. Look here for an introduction.
readnoaa v0.1.1: Provides tidy access to climate and weather data from the National Oceanic and Atmospheric Administration (NOAA) via the National Centers for Environmental Information (NCEI) Data Service API. Covers daily weather observations, monthly and annual summaries, and 30-year climate normals from over 100,000 stations across 180 countries. No API key is required. Dedicated functions handle the most common datasets, while a generic fetcher provides access to all NCEI datasets. See README to get started.
Ecology
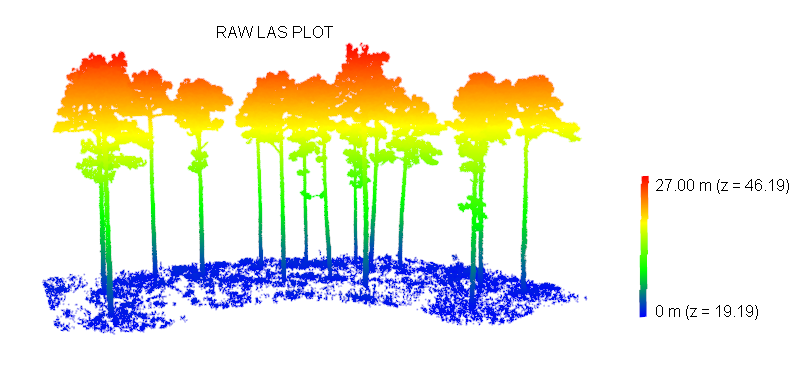
FuelDeep3D v0.1.1: Provides tools for preprocessing, feature extraction, and segmentation of three-dimensional forest point clouds derived from terrestrial laser scanning. Functions support creating height-above-ground metrics, tiling, and sampling point clouds, generating training datasets, applying trained models to new point clouds, and producing per-point fuel classes such as stems, branches, foliage, and surface fuels. Deep learning segmentation relies on the PointNeXt architecture described by Qian et al. (2022) while ground classification utilizes the Cloth Simulation Filter algorithm by Zhang et al. (2016). See README for examples.
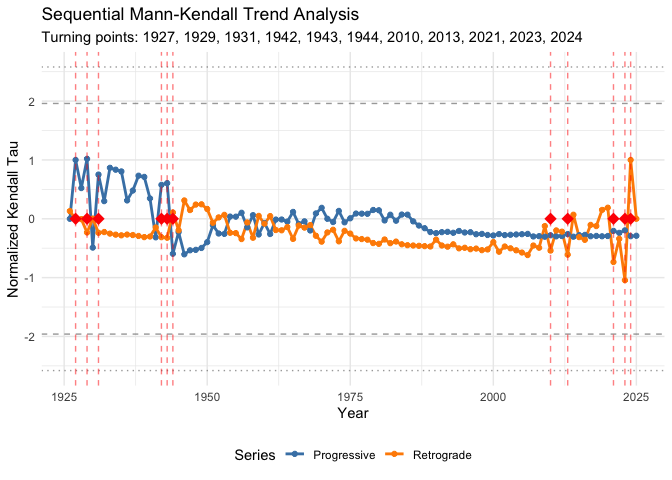
pep725 v1.0.2: Provides a framework for quality-aware analysis of ground-based phenological data from the PEP725 Pan-European Phenology Database Templ et al. (2018) and Templ et al. (2026) and similar observation networks. Implements station-level data quality grading, outlier detection, phenological normals (climate baselines), anomaly detection, elevation and latitude gradient estimation with robust regression, spatial synchrony quantification, partial least squares regression for identifying temperature-sensitive periods, and sequential Mann-Kendall trend analysis. There are four vignettes including Getting Started and Phenological Analysis.
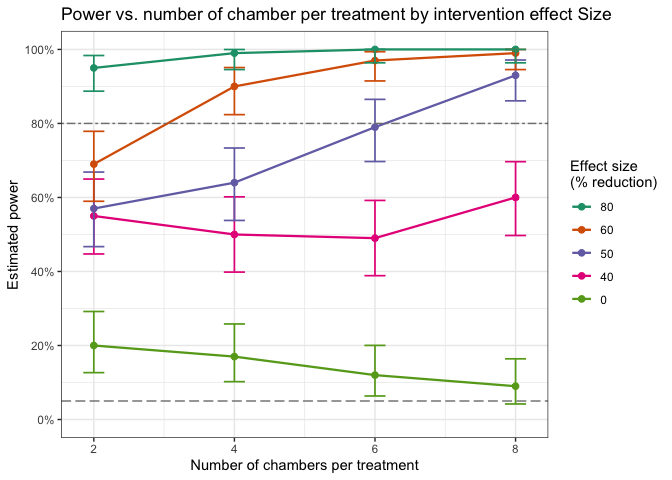
simpowa v1.0.3: Uses simulations from generalized linear mixed-effects models to incorporate random effects across multiple sources and levels of variation, and a dispersion parameter to account for overdispersion and capture unexplained variability. Covers design scenarios for both short-term and long-term trials evaluating the impact of single or combined vector control interventions. Methods build on Kipingu et al. (2025) and Johnson et al. (2015). See README to get started.
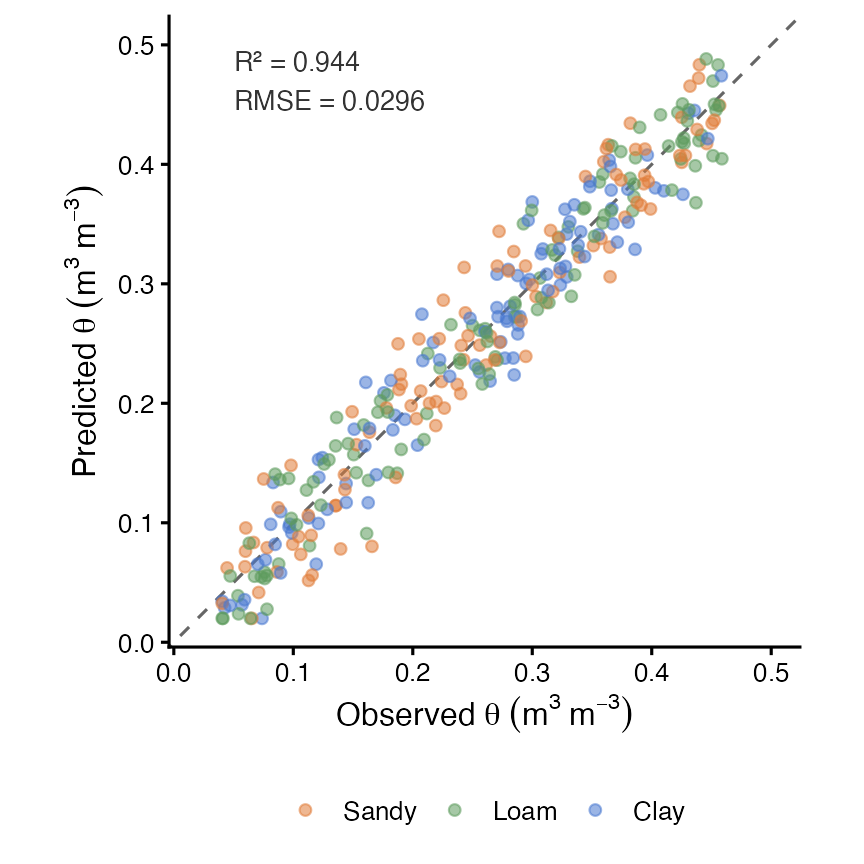
soilFlux v0.1.5: Implements a physics-informed one-dimensional convolutional neural network (CNN1D-PINN) for estimating the complete soil water retention curve (SWRC) as a continuous function of matric potential, from soil texture, organic carbon, bulk density, and depth. The network architecture ensures strict monotonic decrease of volumetric water content with increasing suction by construction, through cumulative integration of non-negative slope outputs (monotone integral architecture). Four physics-based residual constraints adapted from Norouzi et al. (2025). See README and the vignette.
Health Technology Assessment
drMAIC v0.1.0: Implements Doubly Robust Matching-Adjusted Indirect Comparison for population-adjusted indirect treatment comparisons in health technology appraisal. Features include standard MAIC via entropy balancing, augmented/doubly robust MAIC combining inverse probability weighting with outcome regression, comprehensive covariate balance diagnostics, Love plots, sensitivity analyses, bootstrap confidence intervals and submission-ready outputs aligned with NICE Decision Support Unit Technical Support Document 18, Cochrane Handbook guidance on indirect comparisons, and ISPOR best practice guidelines. See the vignette.
Mathematics
wkpool v0.3.0: Provides functions to establish and maintain vertex pool topology for geometry characterized by the Well-known text markup language. In this framework, segments are the atomic unit, vertices are shared via integer references into a pool. Topology is made discoverable via coincident vertex detection while not requiring modification of the input data. Topological data models follow principles described in Worboys and Duckham (2004). The edge-based topology geometry decomposed into vertices and directed edge pairs is a simplification of the quad-edge case in Guibas & Stolfi (1985). See the vignettes Segments: the atoms of geometry and wkpool: Topology-based Geometry Handling.
Medical Statistics
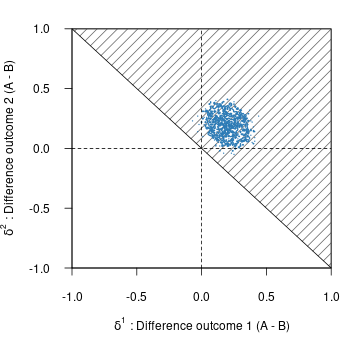
bmco v0.1.0: Provides Bayesian methods for comparing groups on multiple binary outcomes. Includes basic tests using multivariate Bernoulli distributions, subgroup analysis via generalized linear models, and multilevel models for clustered data. For statistical underpinnings, see Kavelaars, Mulder, and Kaptein (2020), Kavelaars, Mulder, and Kaptein (2024) and Kavelaars, Mulder, and Kaptein (2023). See the Shiny app for performing sample size computations. There are three vignettes including Introduction and Subgroup Analysis with Multivariate Binary Outcomes.
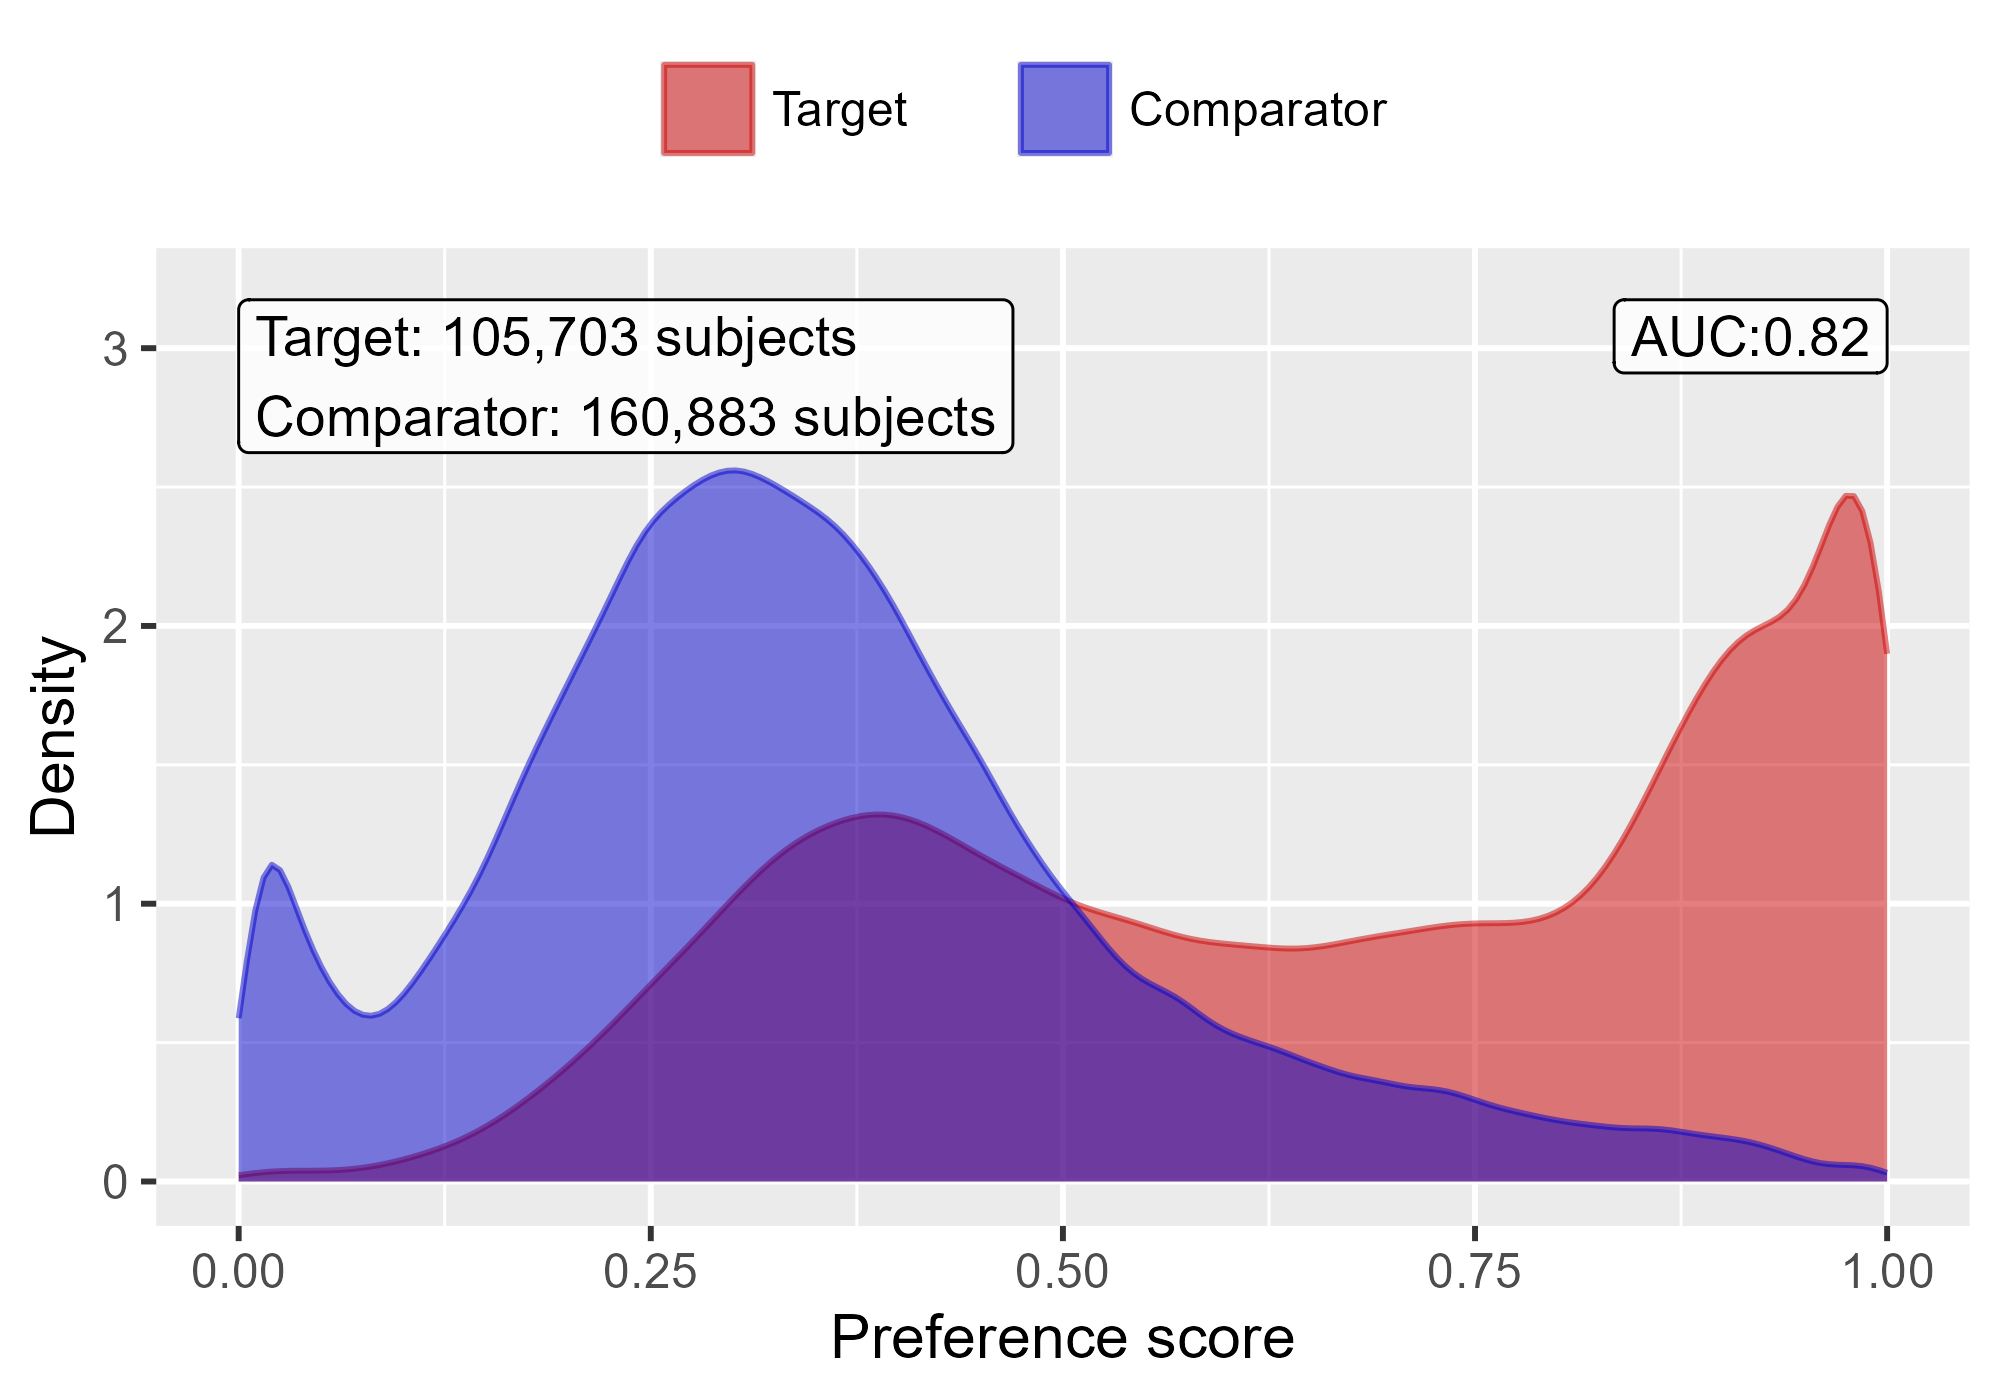
CohortMethod v6.0.1: Provides functions for performing comparative cohort studies in an observational database in the Observational Medical Outcomes Partnership (OMOP) Common Data Model which implements large-scale propensity scores (LSPS) as described in Tian et al. (2018). Functions are included for trimming, stratifying, matching and weighting by propensity scores, and diagnostics. See Suchard et al. (2013) for methods of using large scale regularized regression for fitting propensity models. There are three vignettes including Single Studies and Multiple Analyses.
epicR v1.0.1: Implements a Discrete Event Simulation model that simulates health outcomes of patients with Chronic Obstructive Pulmonary Disease (COPD) based on demographics and individual-level risk factors. It is based on the model published in Sadatsafavi et al. (2019). There are four vignettes including Getting Started and Background.
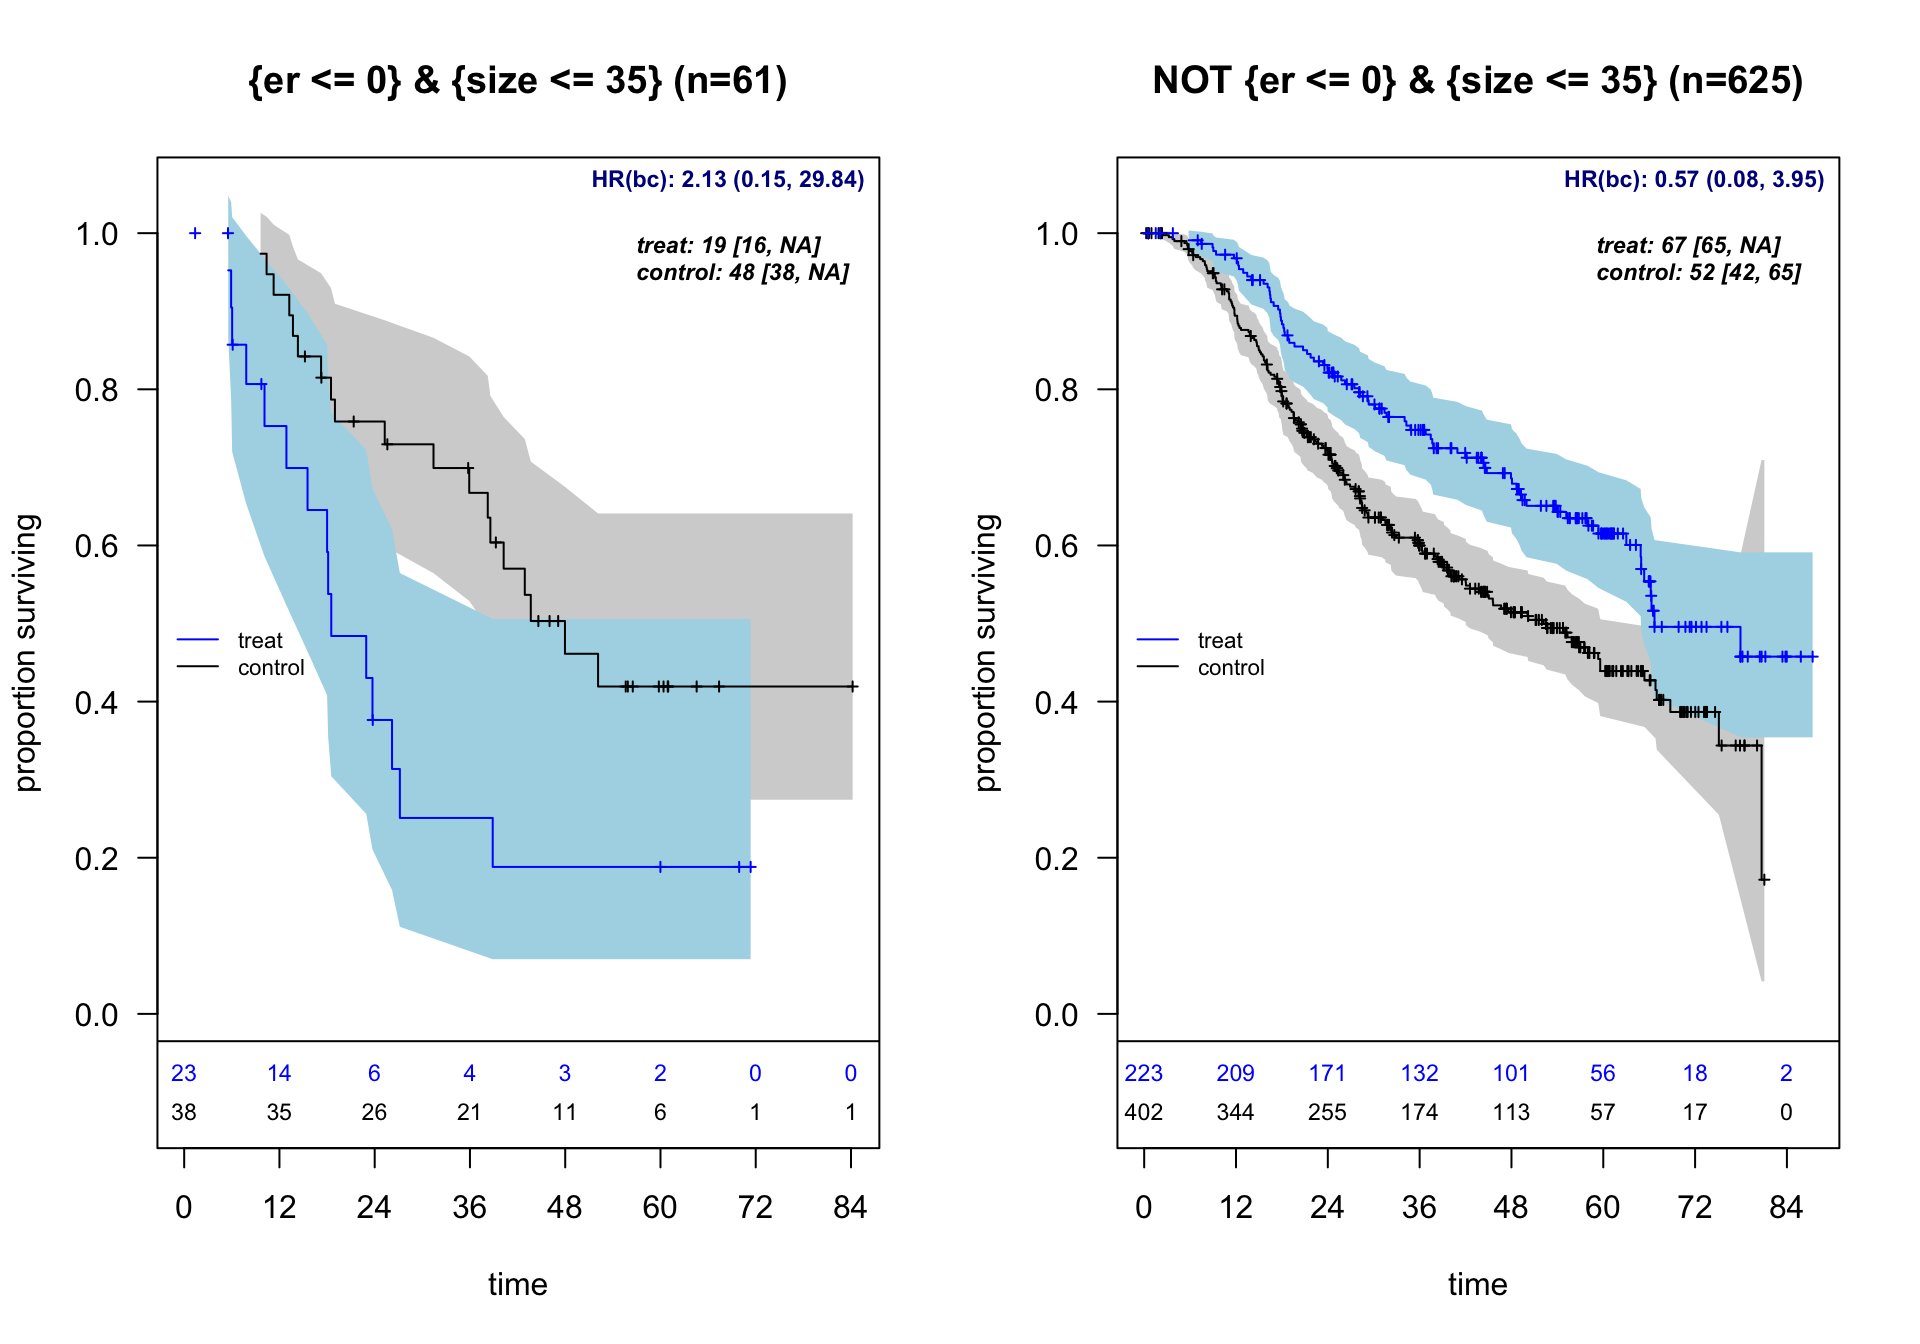
forestsearch v0.1.0: Designed for clinical researchers conducting exploratory subgroup analyses in randomized controlled trials, particularly for multi-regional clinical trials requiring regional consistency evaluation. The package implements statistical methods for exploratory subgroup identification in clinical trials with survival endpoints. Features include machine learning tools for identifying patient subgroups with differential treatment effects and bootstrap bias correction methods using the infinitesimal jackknife methods to address selection bias in post-hoc analyses. See León et al. (2024) for background and the vignette for examples.
mrddGlobal v0.1.0: Provides functions for global testing for regression discontinuity designs with more than one running variable including functions for testing whether there exist non-zero treatment effects along the boundary of the treated region, and testing whether there exist discontinuities in the joint density of the running variables along the boundary of the treated region. See Samiahulin (2026) for background and the vignette for examples.

Probability
ZeroOneDists v1.0.0: Implements new statistical distributions on the (0, 1) interval. Each distribution includes the traditional functions as well as an additional function called the family function, which can be used to estimate parameters using Generalized Additive Models for location, scale and shape, GAMLSS by Rigby & Stasinopoulos (2005).
Programming
arl v0.1.4: Provides a Scheme-inspired Lisp dialect embedded in R, with macros, tail-call optimization, and seamless interoperability with R functions and data structures. (The name ‘arl’ is short for ‘An R Lisp.’) Implemented in pure R with no compiled code. Note that the twenty-two vignettes only contain links to the source code. Look here to get started, and here for the layout of the source code.
restrictR v0.1.0: Provides functions to build reusable validators from small building blocks using the base pipe operator. Define runtime contracts once with restrict() and enforce them anywhere in code. Validators compose naturally, support dependent rules via formulas, and produce clear, path-aware error messages. No DSL, no operator overloading, just idiomatic R. See the vignette.
Public Health
episomer v3.0.34: Provides functions to automatically monitor trends of social media messages by time, place and topic aiming at detecting public health threats early through the detection of signals (i.e., an unusual increase in the number of messages per time, topic and location). It was designed to focus on infectious diseases, and it can be extended to all hazards or other fields of study by modifying the topics and keywords. More information on the original package epitweetr is available in the peer-review publication Espinosa et al. (2022). There are two vignettes: vignettes user documentation and add new social media. Look here for additional documentation including information about the associated Shiny app.
Risk Analysis
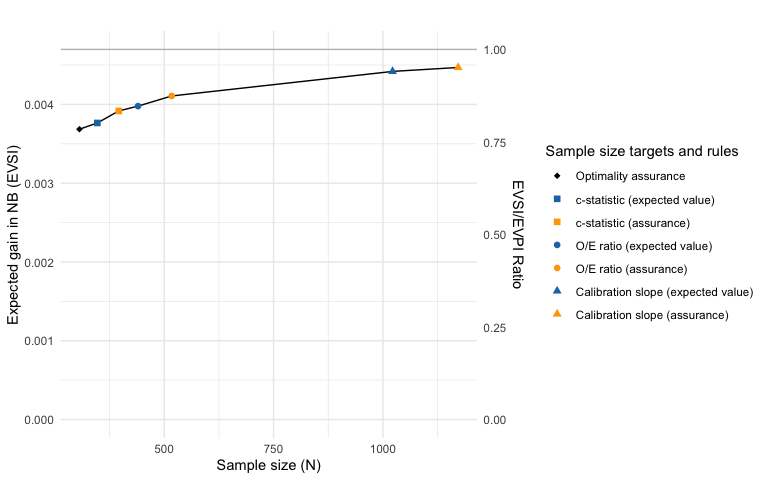
bayespmtools v0.0.1: Provides functions to perform Bayesian sample size, precision, and value-of-information analysis for external validation of existing multi-variable prediction models using the approach proposed by Sadatsafavi et al. (2025). There is a Getting Started Guide and a tutorial.
Statistics
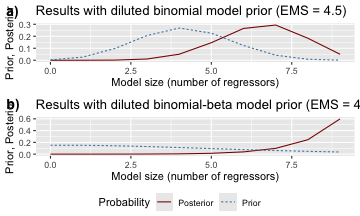
badp v0.4.0.1: Implements Bayesian model averaging for dynamic panels with weakly exogenous regressors as described in the paper by Moral-Benito (2013) and provides functions to estimate dynamic panel data models and analyze the results of the estimation. See the vignette.
BORG v0.3.1: Provides tools for valid spatial, temporal, and grouped model evaluation. Automatically detects data dependencies (spatial autocorrelation, temporal structure, clustered observations), generates appropriate cross-validation schemes (spatial blocking, checkerboard, hexagonal, KNNDM, environmental blocking, leave-location-out, purged CV), and validates evaluation pipelines for leakage. Includes area of applicability assessment following Meyer & Pebesma (2021). Roberts et al. (2017) and Linnenbrink et al. (2024). There are three vignettes including Quick Start and Risk Taxonomy.
flexhaz v0.5.1: Implements a framework for specifying survival distributions through their hazard (failure rate) functions. Functions enable defining arbitrary time-varying hazard functions to model complex failure patterns including bathtub curves, proportional hazards with covariates, automatically compute survival, CDF, PDF, and quantile estimates, and implement the likelihood model interface for maximum likelihood estimation with right-censored and left-censored survival data. There are five vignettes including flexhaz: Hazard-First Survival Modeling and Dynamic Failure Rate Distributions.
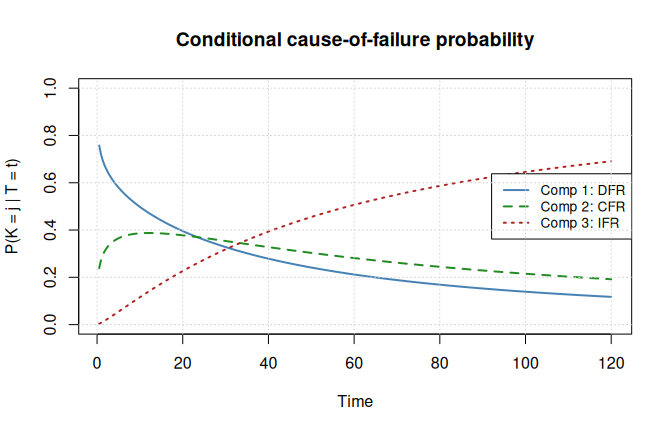
maskedcauses v0.9.3: Implements maximum likelihood estimation for series systems where the component cause of failure is masked. Includes analytical log-likelihood, score, and Hessian functions for exponential, homogeneous Weibull, and heterogeneous Weibull component lifetimes under masked cause conditions. Supports exact, right-censored, left-censored, and interval-censored observations via composable observation functors. Also provides random data generation, model fitting, and Fisher information for asymptotic inference. See Lin, Loh, and Bai (1993) and Craiu and Reiser (2006) for background. There are seven vignettes including Censoring Types in Series System Masked Data and Model Selection for Masked Series Systems via Likelihood Ratio Tests.
mmbcv v0.3.0: Provides a function to compute robust and bias-corrected sandwich variance estimators for multi-state Cox models with clustered time-to-event data. The methodology extends the marginal Cox model bias-correction framework of Wang et al. (2023) to the multi-state setting. See the vignette.
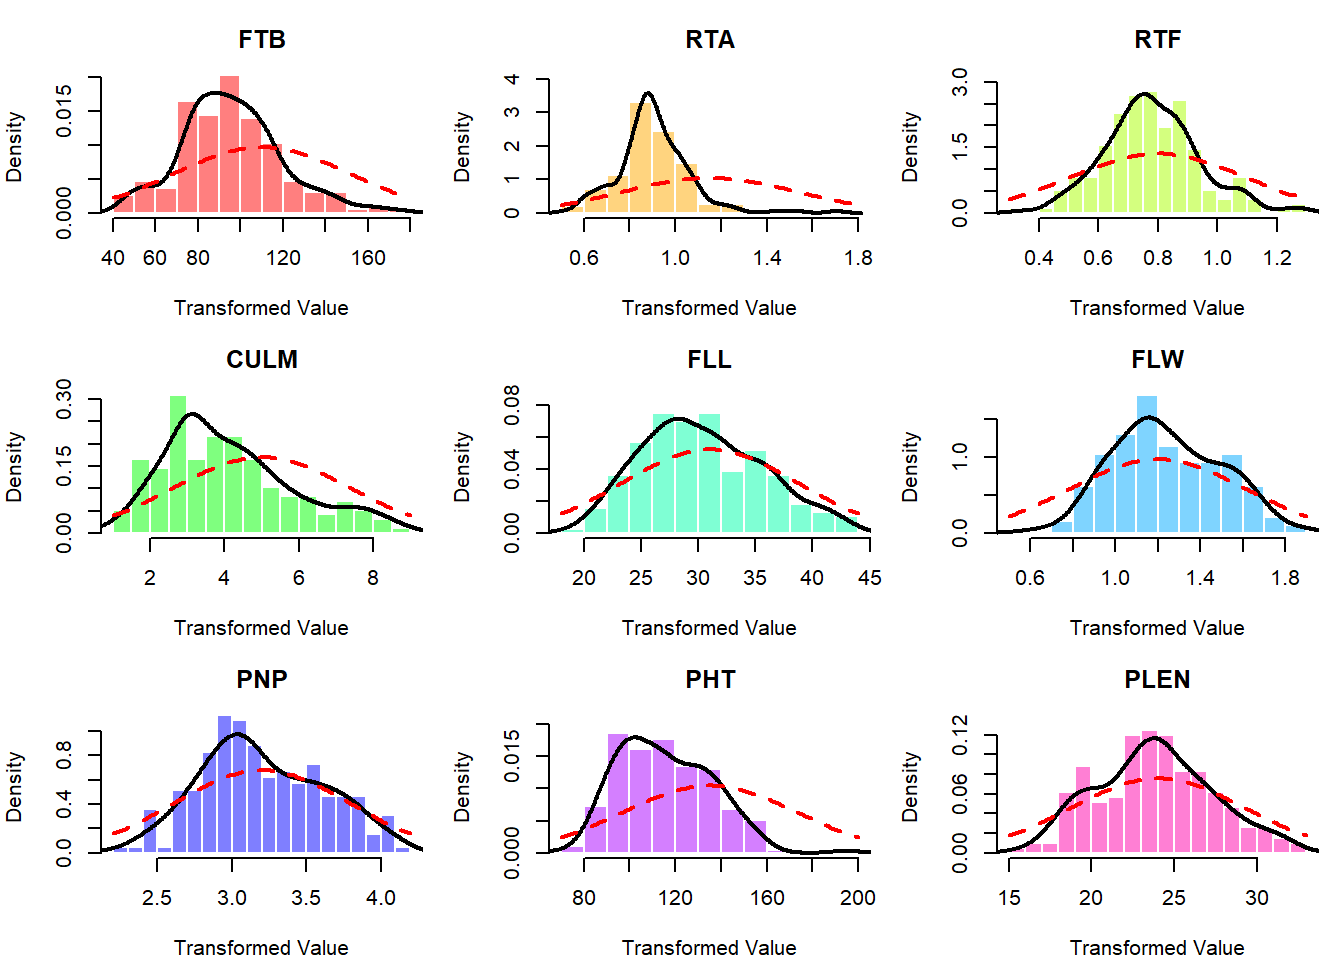
osktnorm v1.1.2: Implements a moment-targeting normality transformation based on the simultaneous optimization of Tukey g-h distribution parameters designed to minimize both asymmetry (skewness) and excess peakedness (kurtosis) in non-normal data by mapping it to a standard normal distribution as described by Cebeci et al. (2026). Optimization is performed by minimizing an objective function derived from the Anderson-Darling goodness-of-fit statistic with Stephens’s correction factor, utilizing the L-BFGS-B algorithm for robust parameter estimation. This approach provides an effective alternative to power transformations like Box-Cox and Yeo-Johnson, particularly for data requiring precise tail-behavior adjustment. See the vignettes OSKT: Normality Transformation via Optimized Skewness and Kurtosis and A Practical Example for Working with Datasets.
RFmstate v0.1.2: Provides functions to fit cause-specific random survival forests for flexible multistate survival analysis with covariate-adjusted transition probabilities computed via product-integral. State transitions are modeled by random forests. Subject-specific transition probability matrices are assembled from predicted cumulative hazards using the product-integral formula. Also provides a standalone Aalen-Johansen nonparametric estimator as a covariate-free baseline, per-transition feature importance, bias-variance diagnostics, and comprehensive visualizations. Handles right censoring and competing transitions. Methods are described in Ishwaran et al. (2008) for random survival forests, Putter et al. (2007) for multistate competing risks decomposition, and Aalen and Johansen (1978) for the nonparametric estimator. See the vignette for an introduction.
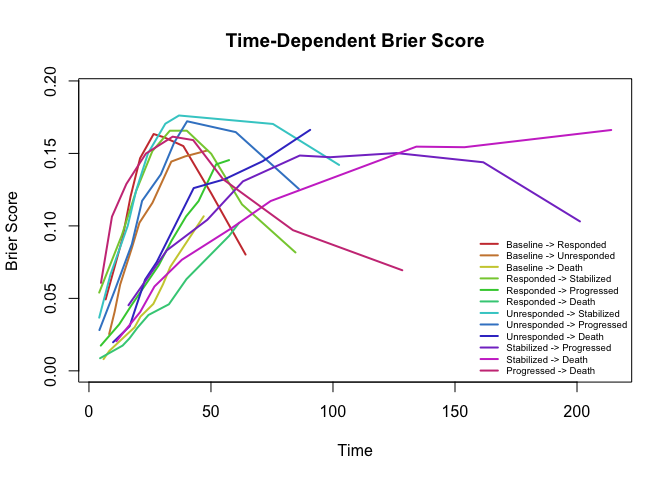
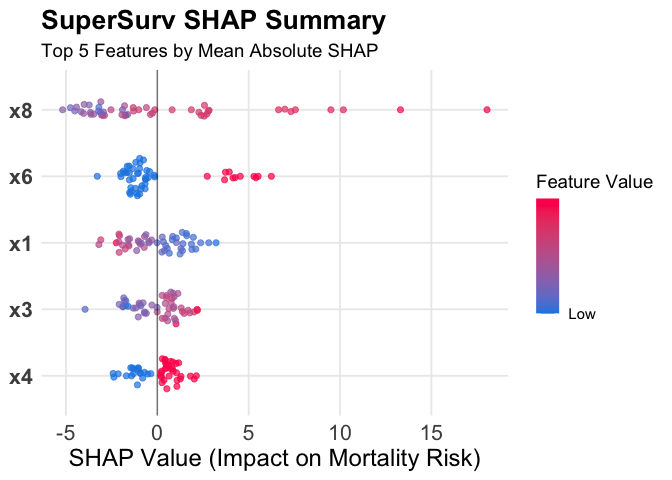
SuperSurv v0.1.1: Implements a Super Learner framework for right-censored survival data. The package fits convex combinations of parametric, semiparametric, and machine learning survival learners by minimizing cross-validated risk using inverse probability of censoring weighting. It provides tools for automated hyperparameter grid search, high-dimensional variable screening, and evaluation of prediction performance using metrics such as the Brier score, Uno’s C-index, and time-dependent area under the curve. See Westling et al. (2024) and Lyu et al. (2026) for background. There are eleven vignettes including Machine Learning and 8. Interpreting the Black Box with SHAP & survex.
Time Series
betaARMA v1.1.0: Provides functions to fit Beta Autoregressive Moving Average (BARMA) models for time series data distributed in the standard unit interval (0, 1). The estimation is performed via the conditional maximum likelihood method using the Broyden-Fletcher-Goldfarb-Shanno (BFGS) quasi-Newton algorithm. The package includes tools for model fitting, diagnostic checking, and forecasting. Based on the work of Rocha and Cribari-Neto (2009) and the associated erratum Rocha and Cribari-Neto (2017). Look here to get started.
boundedur v1.0.1: Implements unit root tests for bounded time series following Cavaliere and Xu (2014). Standard unit root tests (ADF, Phillips-Perron) have non-standard limiting distributions when the time series is bounded. This package provides modified ADF and M-type tests (MZ-alpha, MZ-t, MSB) with p-values computed via Monte Carlo simulation of bounded Brownian motion. Supports one-sided (lower bound only) and two-sided bounds, with automatic lag selection using the MAIC criterion of Ng and Perron (2001). See README to get started.
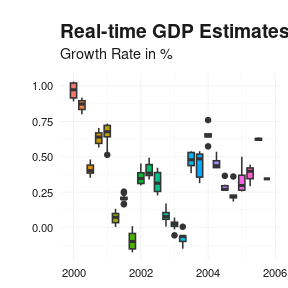
reviser v0.1.1: Analyzes revisions in real-time time series vintages. Functions convert between wide revision triangles and tidy long vintages, extract selected releases, compute revision series, visualize vintage paths, and summarize revision properties such as bias, dispersion, autocorrelation, and news-noise diagnostics. There are also functions to identify efficient releases and estimate state-space models for revision nowcasting. Methods are based on Howrey (1978), Jacobs and Van Norden (2011), and Kishor and Koenig (2012). There are seven vignettes including Introduction and revision analysis.
Utilities
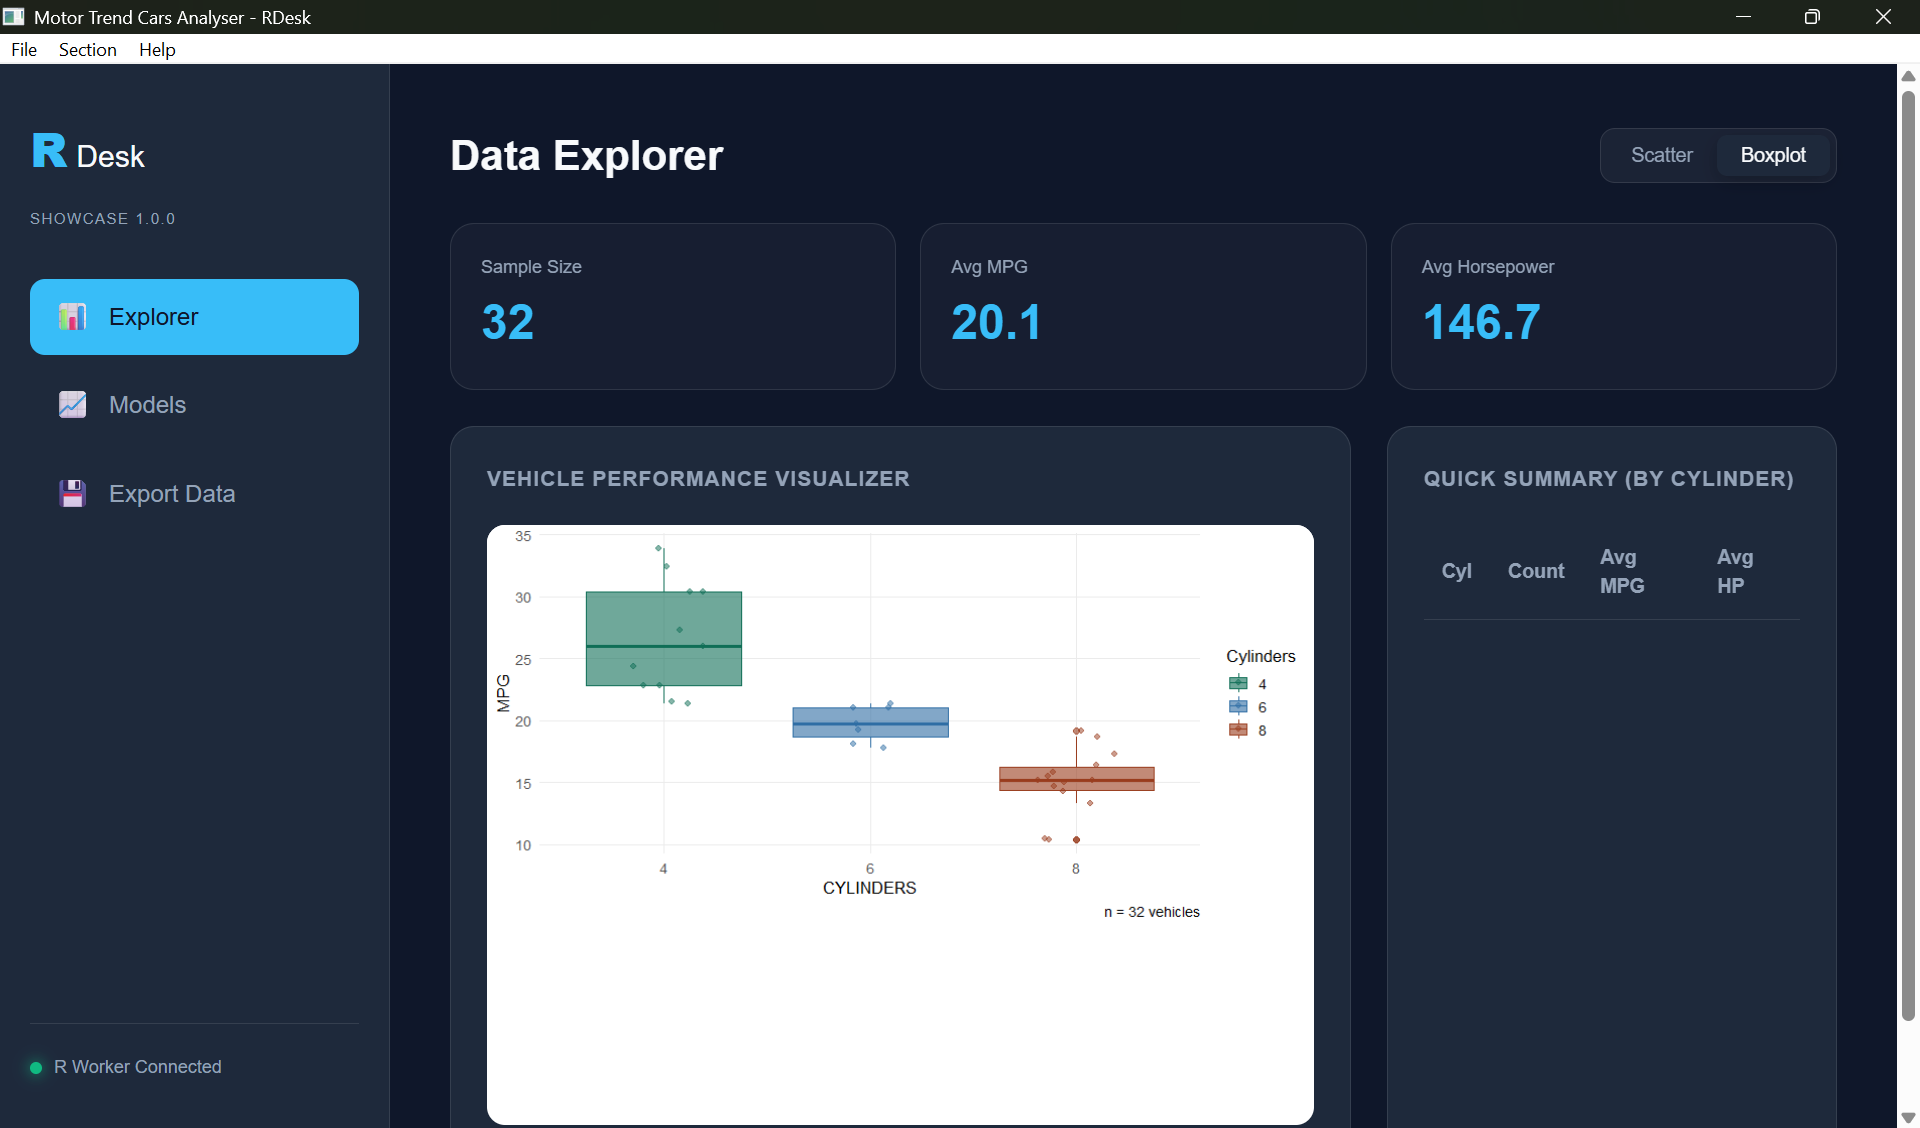
RDesk v1.0.5: Allows R developers to build native Windows desktop applications using R and WebView and create professional, standalone desktop tools with modern web-based user interfaces while maintaining a pure R backend. Provides a robust R6-based event loop, asynchronous background task management via mirai and callr, and a native Win32 message bridge for seamless R-to-user-interface communication without listening ports or network overhead. There are seven vignettes including Getting Started and Cookbook.
starburst v0.3.8: Implements a future backend that enables seamless execution of parallel R workloads on Amazon Web Services (‘AWS’), including EC2 and Fargate that handles environment synchronization, data transfer, quota management, and worker orchestration automatically, allowing users to scale from local execution to 100+ cloud workers with a single line of code change. There are twelve vignettes including Getting Started and Example: Parallel Portfolio Risk Modeling.
Visualization
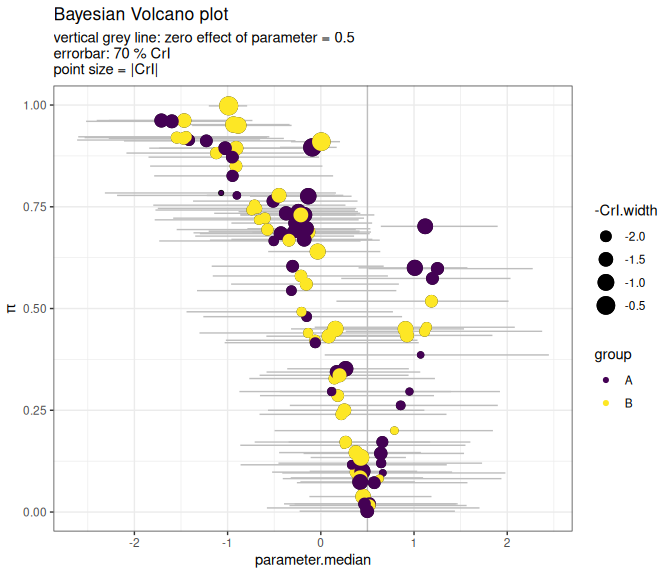
BayesVolcano v1.0.1: Bayesian models are used to estimate effect sizes (e.g., gene expression changes, protein abundance differences, drug response effects) while accounting for uncertainty, small sample sizes, and complex experimental designs. However, Bayesian posteriors of models with many parameters are often difficult to interpret at a glance. One way to quickly identify important biological changes based on frequentist analysis is volcano plots (using fold-changes and p-values). Bayesian volcano plots bring together the explicit treatment of uncertainty in Bayesian models and the familiar visualization of volcano plots. See Sousa (2020) for background and the vignette for examples.
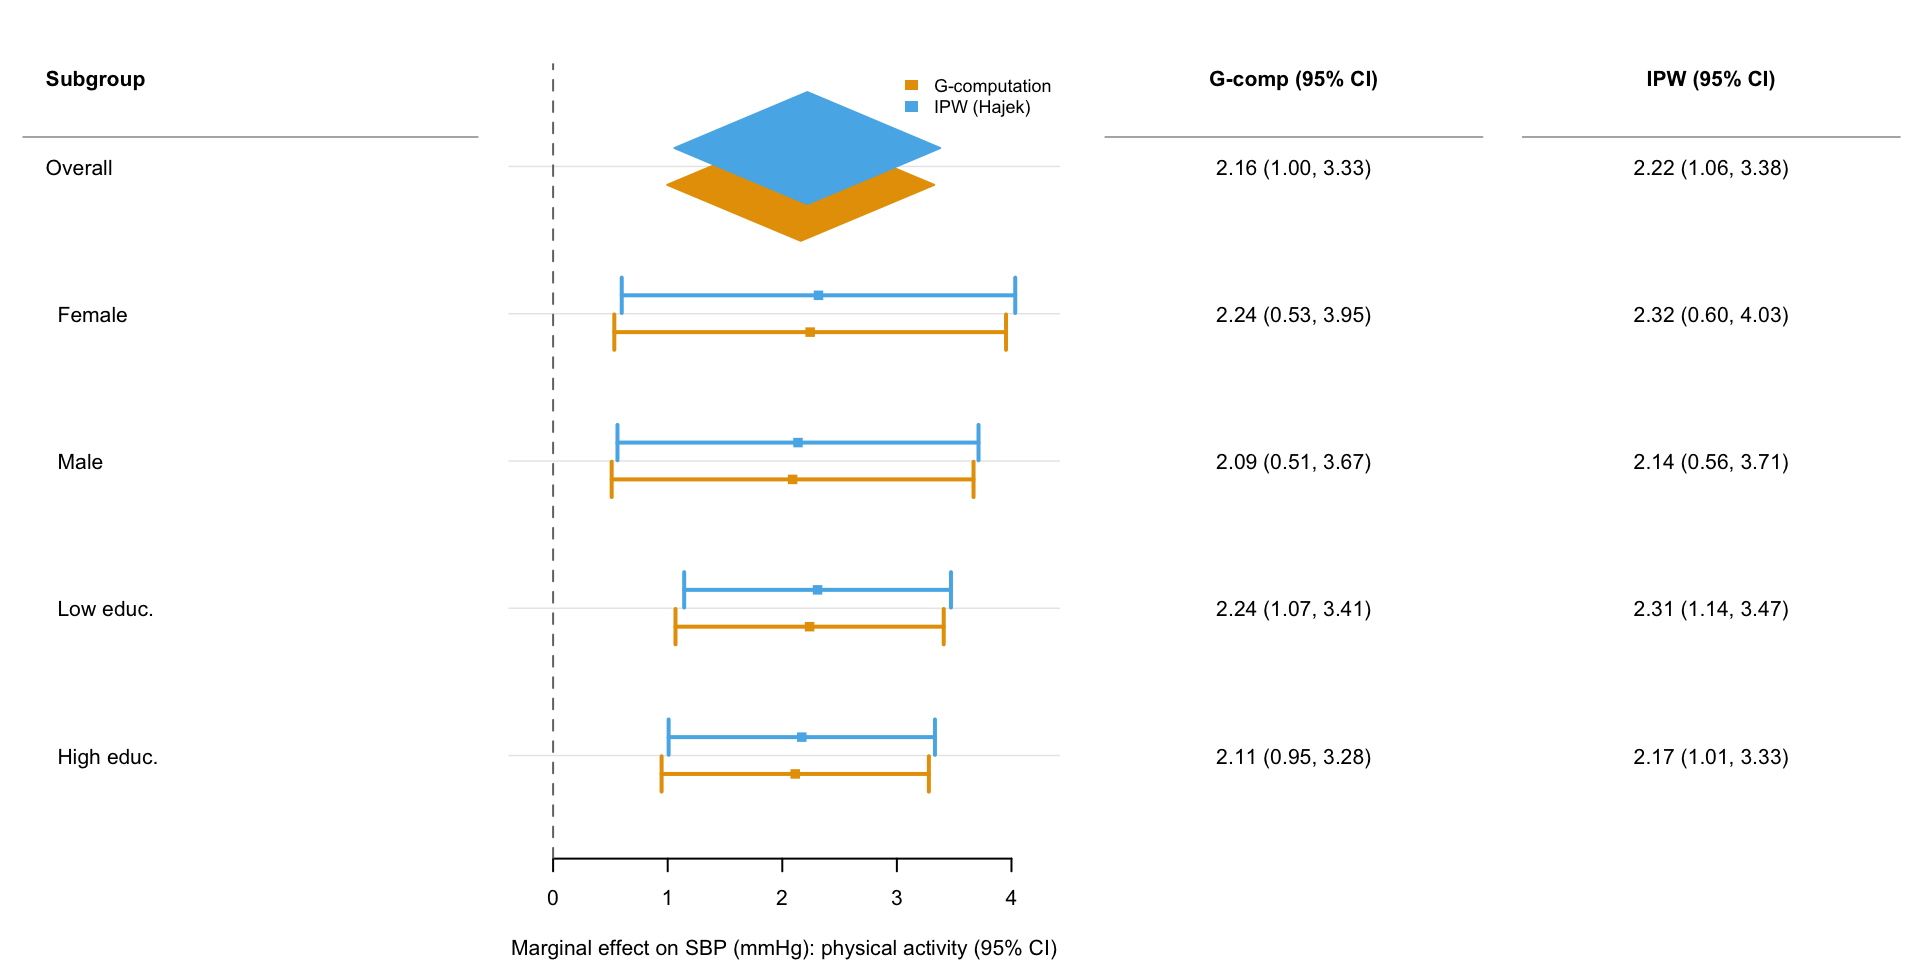
forrest v0.3.0: Provides a function to create publication-ready forest plots from any tabular data containing point estimates and confidence intervals. Suitable for visualizing results from regression models, meta-analyses, subgroup analyses, or any comparative study. Supports group and subgroup headings, summary estimates displayed as diamonds, grouped estimates with automatic color and shape mapping, vertical dodging of multiple estimates within the same row, customisable text columns alongside the plot, and optional row striping. Provides a helper to export plots to PDF, PNG, SVG, or TIFF. Built on tinyplot for clean, consistent visual styling with a minimal dependency footprint. There are four vignettes including Introduction to forrest and How forrest works.
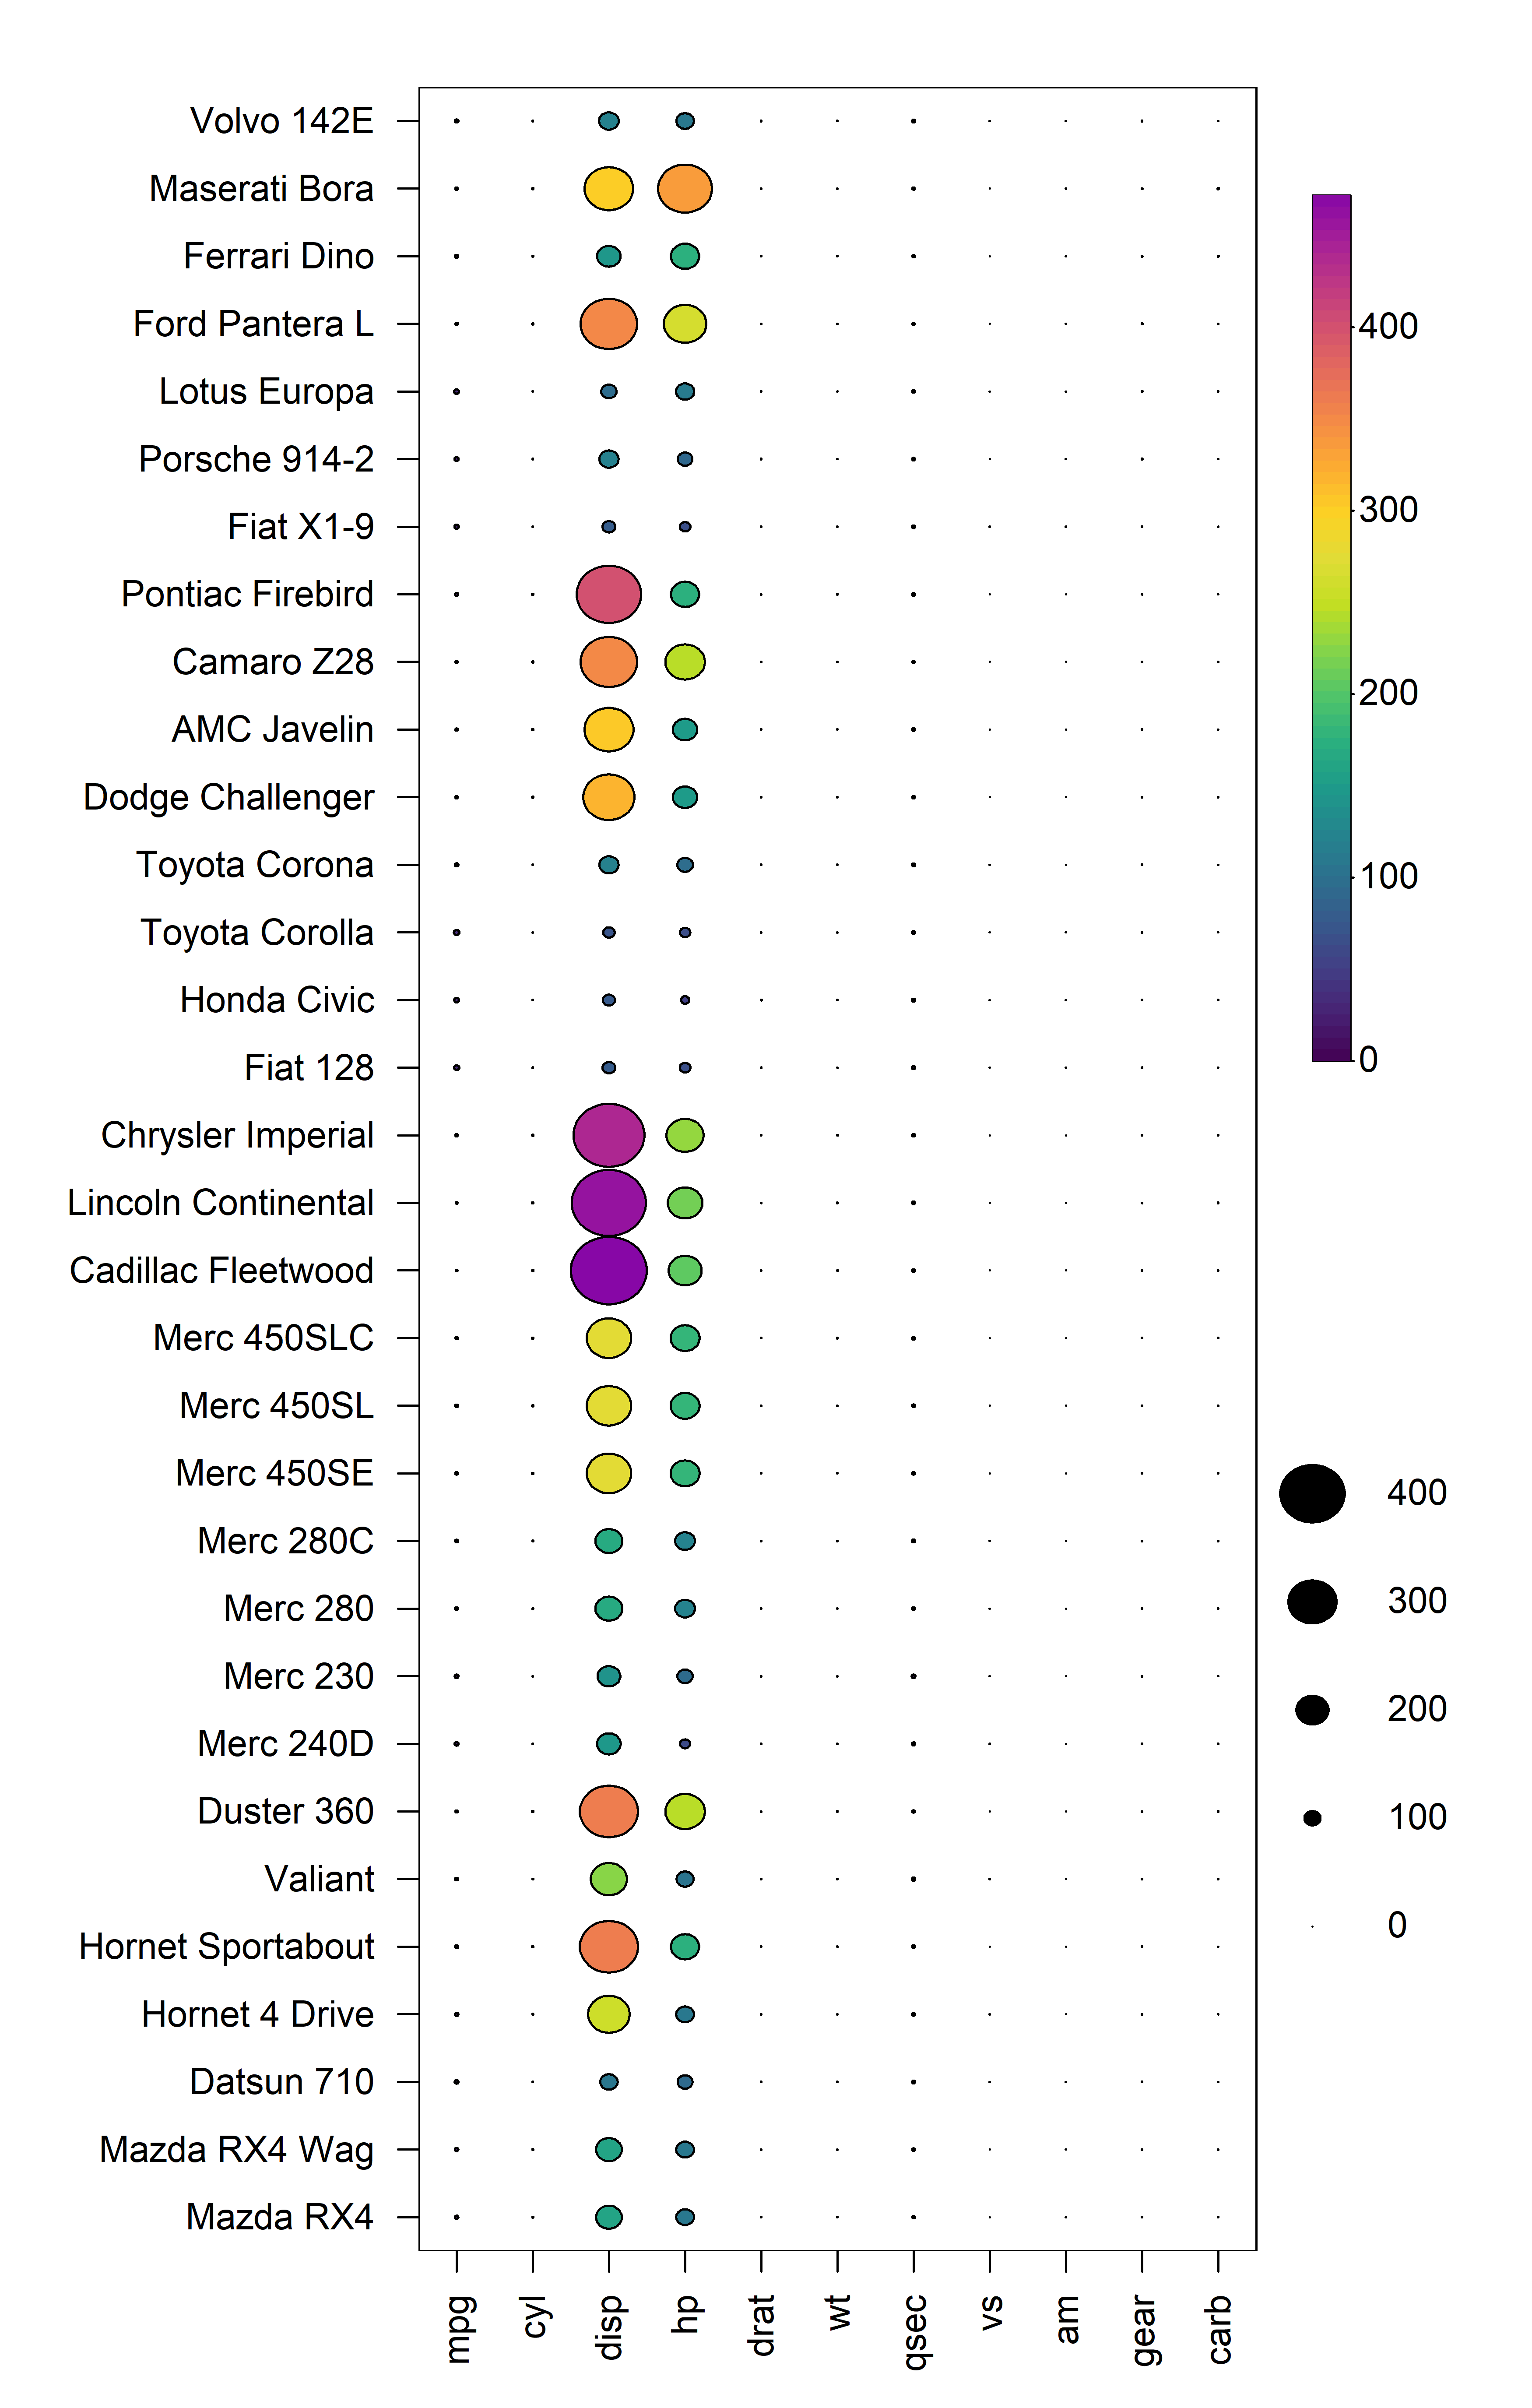
HeatmapR v1.0.0: Provides a lightweight framework for creating high-quality, complex heatmaps using base graphics. Supports hierarchical clustering with dendrograms, column and row scaling, cluster sub-divisions, customizable cell colors, shapes and sizes, legends, and flexible layouts for arranging multiple heatmaps. Designed to return plot objects that can be easily arranged with other plots without sacrificing resolution. Methods for hierarchical clustering and distance computations are described in Murtagh and Contreras (2012). Dendrogram visualization methods are based on the ggdendro package by de Vries and Ripley (2020). See the vignette.