Causal Inference
ciflyr v0.1.1: Provides a framework for specifying flexible linear-time reachability-based algorithms for graphical causal inference. Rule tables are used to encode and customize the ‘reachability’ algorithm for typical causal and probabilistic reasoning tasks, such as finding d-connected nodes or more advanced applications. See Wienöbst, Weichwald and Henckel (2025) for the details.
Computational Methods
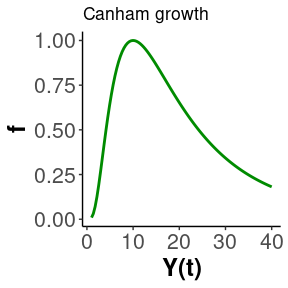
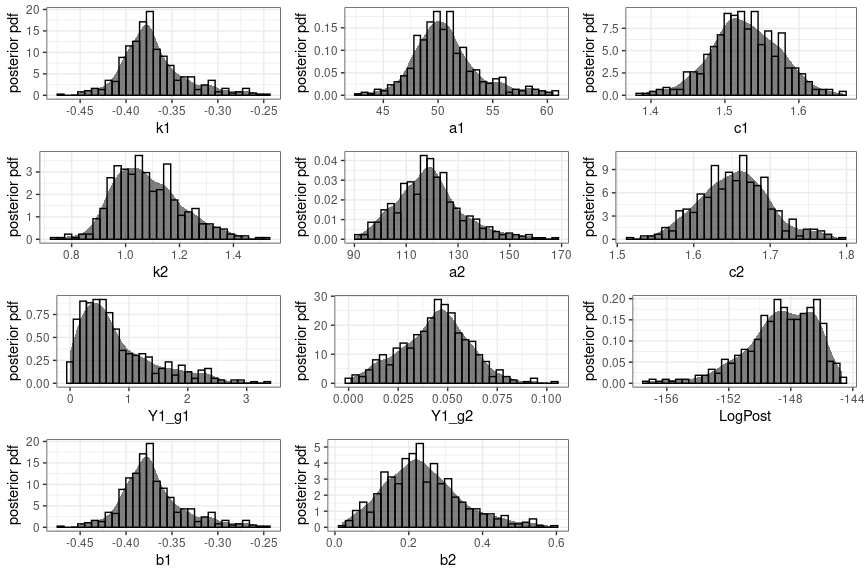
hmde v1.2.1: Implements a wrapper for Stan with a built-in hierarchical Bayesian longitudinal model for repeat observation data. Model choice selects the differential equation that is fit to the observations. See O’Brien et al. (2024) for the theory. There are six vignettes, including Constant Growth and hmde for Mathematicians.
ironseed v0.2.0: Implements a procedure for seeding R’s built in random number generators using a variable-length sequence of values. The algorithm accumulates entropy into a 256-bit hash digest or “ironseed” and generates a variable-length sequence of output seeds. See the vignette for an overview.
RBaM v1.0.1: Implements an interface to the BaM (Bayesian Modeling) engine, a Fortran - based executable for Bayesian estimation with a particular focus on uncertainty quantification. See Renard (2017) for technical details and the vignette for examples.
Data
ArgentinAPI v0.1.0: Provides functions to access data from the ArgentinaDatos API and the REST Countries API related to Argentina’s exchange rates, inflation, political figures, holidays, and general country-level indicators. Additionally, the package includes curated datasets related to Argentina, covering topics such as economic indicators, biodiversity, agriculture, human rights, genetic data, and consumer prices. See the vignette.
bcRP v1.0.1: Enables search and access for more than ten thousand BANCO CENTRAL DE RESERVA DEL PERÚ Gerencia Central de Estudios Económicos (BCRPDATA) data sets. See README for an example.
ChileDataAPI v0.1.0: Provides functions to access data from the FINDIC API and the REST Countries API, related to Chile’s financial indicators, international country information, and more. Additionally, the package includes curated datasets related to Chile, covering topics such as human rights violations during the Pinochet regime, electoral data, census samples, health surveys, seismic events, territorial codes, and environmental measurements. See the vignette.
galaxias v0.1.0: Provides tools to access the Darwin Core data standard for biodiversity information. For details, see Wieczorek et al. (2012). There are three vignettes, including Quick Start Guide and Standardize an Event Dataset.
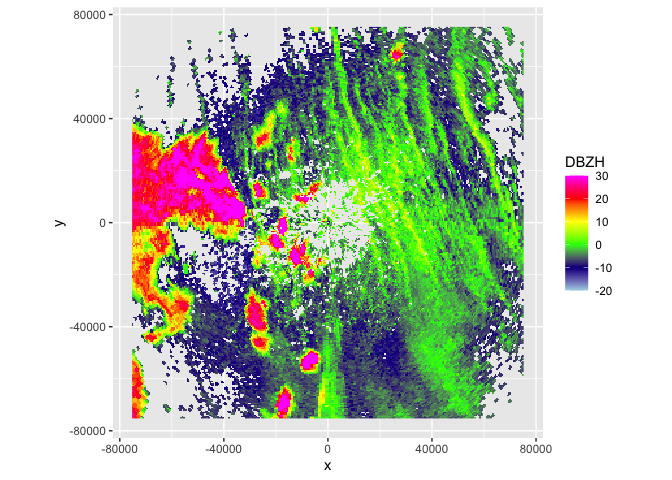
getRad v0.2.0: Provides functions to load polar volume and vertical profile data from several sources in Europe and the US for aeroecological research. See the vignette and GitHub page for examples.
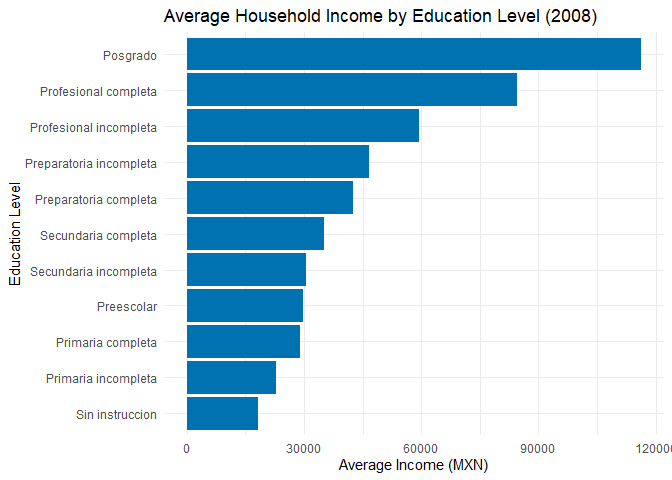
MexicoDataAPI v0.1.0: Provides functions to access data from the World Bank API and the REST Countries API, related to Mexico’s economic indicators, population statistics, literacy rates, and international geopolitical information. Additionally, the package includes curated datasets related to Mexico, including air quality monitoring stations, pollution zones, income surveys, postal abbreviations, election studies, forest productivity, and demographic data by state. See the vignette.
Ecology
commecometrics v1.0.0: Provides a framework for modeling relationships between functional traits and environmental variables at the community level, including tools for trait binning, likelihood-based environmental estimation, model evaluation, fossil projection into modern ecometric space, and visualization. For more details, see Vermillion et al. (2018), Polly et al. (2011), and Polly & Head (2015). There is an Introduction and a vignette on Fossil Commecometrics.
ConFluxPro v1.3.1: Provides tools to model soil gas fluxes with the Flux-Gradient Method, including functions for data handling, a forward and an inverse model for flux modeling, and methods for calibration and uncertainty estimation. For more details, see Gartiser et al. (2025a) and Gartiser et al. (2025b). There are five vignettes, including Flux and Uncertainty Estimation.

Epidemilogy
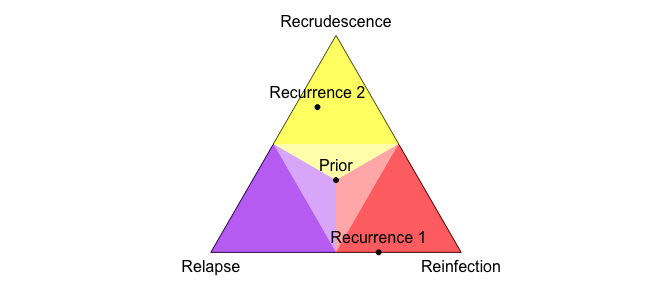
Pv3Rs v0.0.2: Provides functions to plot malaria parasite genetic data on two or more episodes and compute the per-person posterior probabilities that each Plasmodium vivax (Pv) recurrence is a recrudescence, relapse, or reinfection (3Rs) using per-person P. vivax genetic data on two or more episodes. It uses the statistical model described in Taylor, Foo and White (2022. See the vignette for examples.
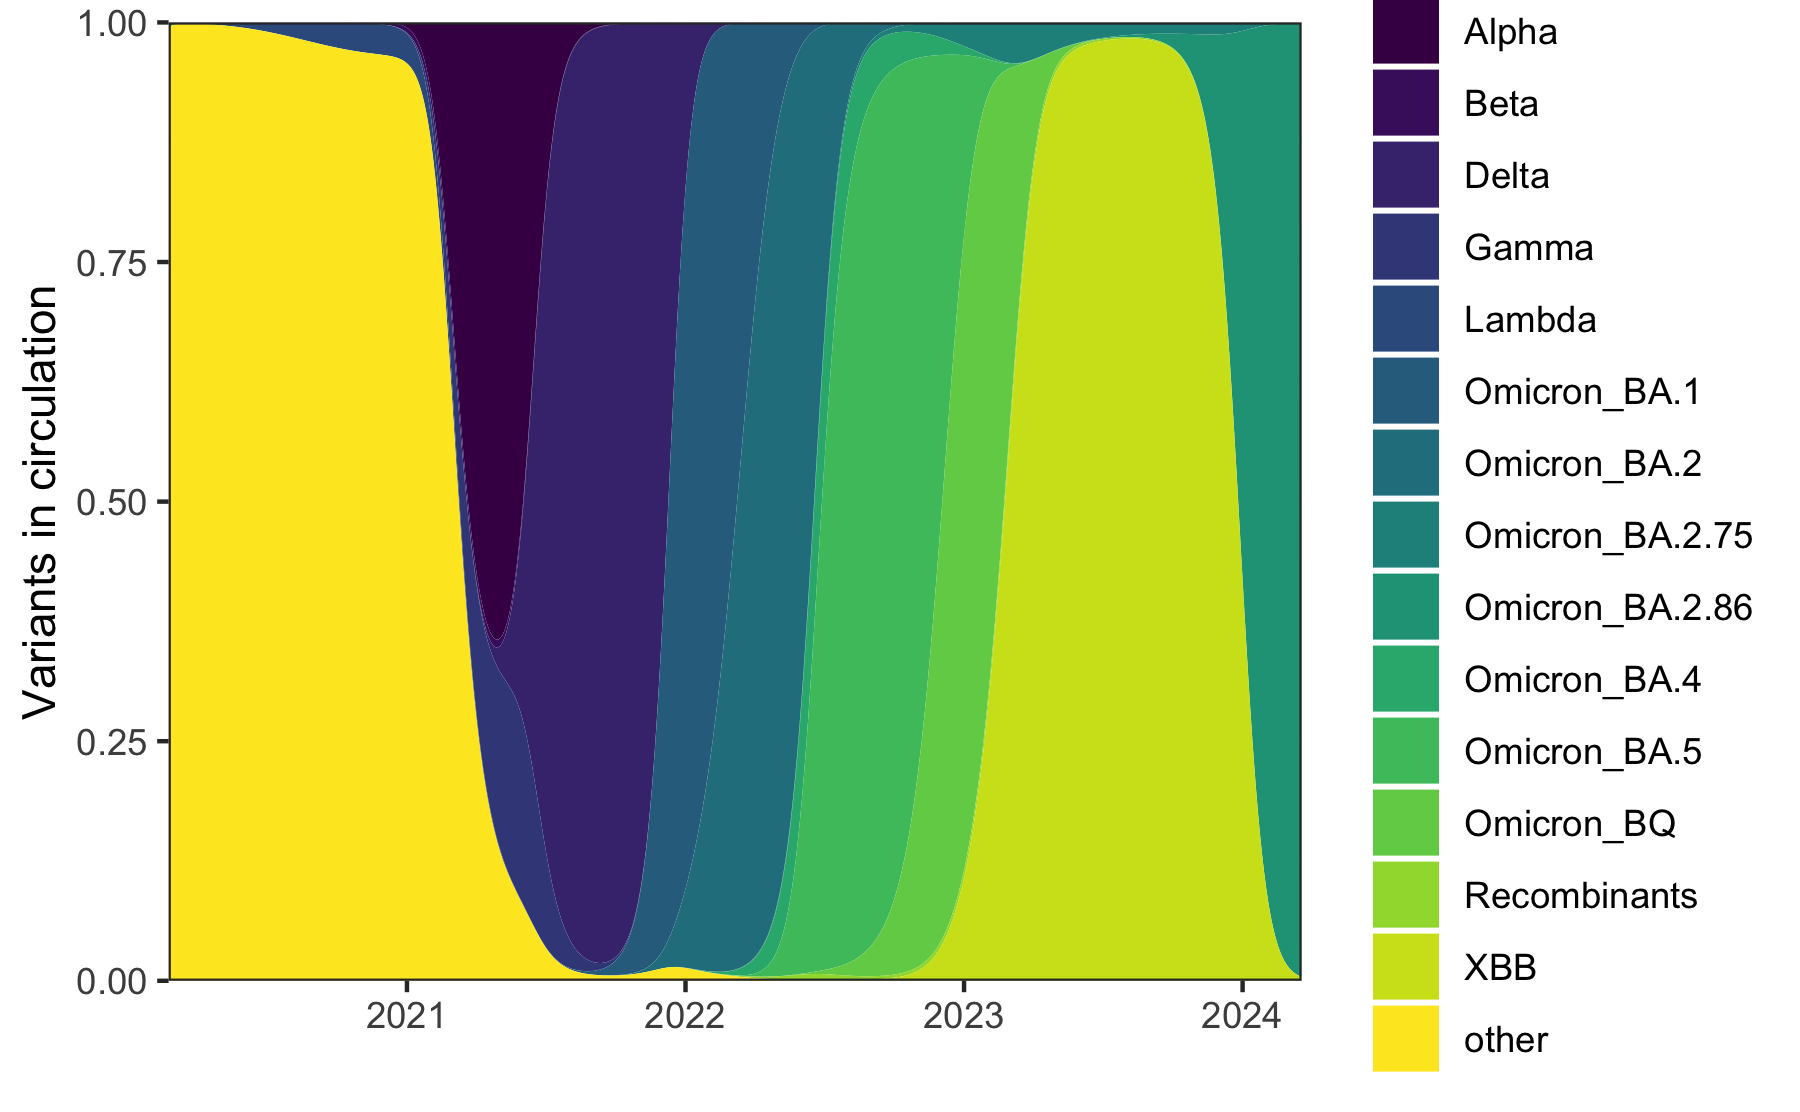
rtestim v1.0.0: Use trend filtering, a type of regularized nonparametric regression, to estimate the instantaneous reproduction number, Rt, which indicates how many new infections will result from each new infection today. See Liu et al.(2024) for background. There is an Introduction and a vignette on Delay Distributions.
Machine Learning
flowcluster v0.2.1: Provides functions for clustering origin-destination pairs flows. Includes functions for creating distance matrices between OD pairs and passing distance matrices to a clustering algorithm. See Tao & Thill (2016) for details on the spatial clustering of flows, Mahfouz et al. (2025) for an extended example, and README to get started.
mrIML v2.1.0: Provides machine learning techniques to automatically fit multiple response models to multivariate data and interpret the results. See Fountain-Jones (2021) and Fountain-Jones et al. (2024) and the vignette for examples.
Silhouette v0.94: Provides tools to quantify clustering quality by measuring both cohesion within clusters and separation between clusters. See Raymaekers & Rousseeuw, (2022), Campello & Hruschka, 2006, and Schepers et al. for background and the vignette for examples.
survdnn v0.6.0: Implements deep learning models for right-censored survival data using the torch back-end that include Cox partial likelihood, L2-penalized Cox, time-dependent Cox, and accelerated failure time loss models. Also provides a formula-based interface, built-in support for cross-validation, hyperparameter tuning, survival curve plotting, and evaluation metrics such as the C-index, Brier score, and integrated Brier score. See Kvamme et al. (2019) for details and look here for examples.
Mathematics
boostmath v1.0.2: Provides R bindings for the various functions and statistical distributions provided by the Boost Math library. There are four vignettes, including Quadrature and Differention and Special Functions.
inteq v1.0: Implements Matthew Thomas’s Python library inteq. Solves Fredholm integral equations of the first kind, \(f(s) = \int_a^b K(s, y) g(y) dy\), using methods described by Twomey (1963). Solves Volterra integral equations of the first kind, \(f(s) = \int_0^s K(s,y) g(t) dt\), using methods from Betto and Thomas (2021). Solves Voltera integral equations of the second kind, \(g(s) = f(s) + \int_a^s K(s,y) g(y) dy\), using methods from Linz (1969). See the vignette.
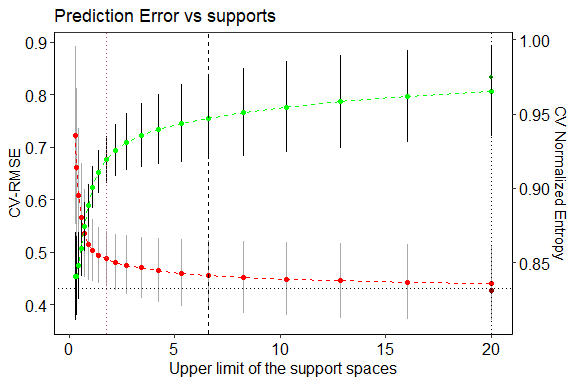
topolow v2.0.0: Implements the Topolow algorithm to embed objects into a low-dimensional Euclidean space from a matrix of pairwise dissimilarities, even when the data do not satisfy metric or Euclidean axioms. The algorithm is particularly well-suited for sparse, incomplete, and censored (thresholded) datasets such as antigenic relationships. It employs a likelihood-based approach to determine the optimal number of dimensions for the embedding, avoiding distortions common in methods with fixed low dimensions. See Arhami & Rohani (2025a) for methods and mathematical proofs, Arhami and Rohani (2025b) for embedding details, and the vignette for an introduction.
Medical Statistics
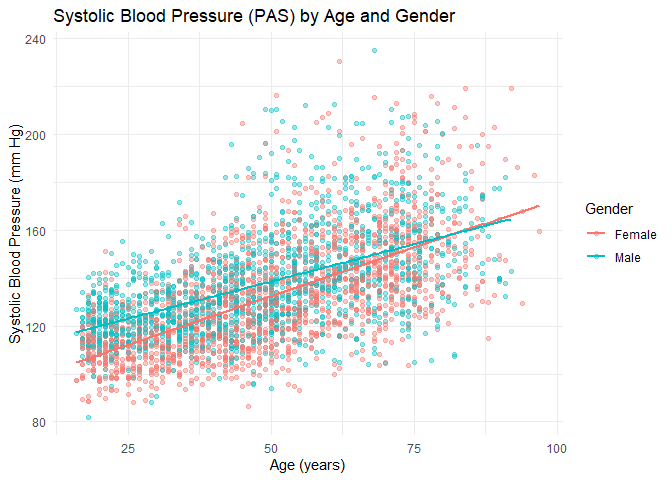
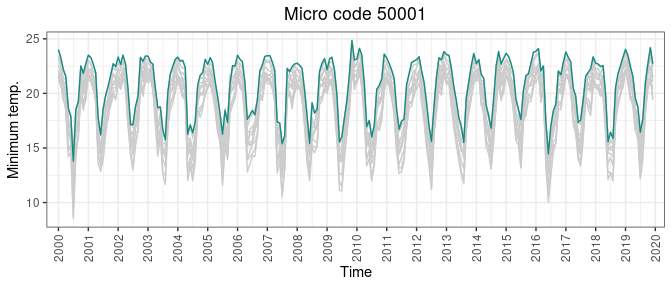
GHRexplore v0.1.1: Provides commonly used visualizations of temporal and spatio-temporal health data including case counts, incidence rates, and covariates including time series, heatmaps, seasonality plots, maps and more. See the vignette.
MDCcure v0.1.0: Provides functions to compute martingale difference correlation, martingale difference divergence, and partial extensions to assess conditional mean dependence. Also implements a novel hypothesis test for evaluating covariate effects on the cure rate in mixture cure models. See Shao & Zhang (2014) for background on the martingale methods and the vignette for information on the covariate effects test.
Pharma
junco v0.1.1: Provides general and reusable tooling for use alongside rtables, rlistings, and tern for creating table and listing outputs. Major features include: extended statistical analyses beyond what tern supports for safety and efficacy tables, a robust production-grade RTF exporter for both tables and listings, structural support for spanning column headers and risk difference columns in tables, and robust font-aware automatic column width algorithms for both listings and tables. See the vignettes Automatic Column Widths and Tabulation.
verifyr2 v1.0.0: Provides Extendable R6 file comparison classes, and a shiny App for integrating comparison functions into file comparison applications. The idea originates from the pharma drug development processes, which require different versions of files and datasets to be compared and reviewed. See README.
Statistics
GCEstim v0.1.0: Provides functions for regression estimation and inference using the Generalized Maximum Entropy (GME) and Generalized Cross Entropy (GCE) framework, a flexible method for solving ill-posed inverse problems and parameter estimation under uncertainty. See Macedo et al. (2025), Macedo & Costa (2019), and Macedo (2022) for background. There are seven vignettes, including Quick Start and Generalized Maximum Entropy framework.
gilmour v0.1.1: Implements the method described in Gilmour (1996) for selecting a subset of regressors from a set of k candidate variables in multiple linear regression. All possible regression models are compared using Mallows’s Cp statistic, and the submodel with the minimum adjusted value Cp (ModelMin) is identified. The final model is selected by applying a sequence of hypothesis tests on submodels nested within ModelMin. See the vignette for an overview and example.

hbsaems v0.1.1: Implements Hierarchical Bayesian Small Area Estimation models using the brms package to facilitate a principled Bayesian workflow, enabling users to conduct prior predictive checks, model fitting, posterior predictive checks, model comparison, and sensitivity analysis in a coherent and reproducible manner. See Rao and Molina (2015) for background on the methods implemented. There are seven vignettes, including Hierarchical Bayesian Small Area Modeling and Logit-normal model and a shinydashboard.
ROCnGO v0.1.0: Provides tools for analyzing classifier performance by using receiver operating characteristic (ROC) curves. Performance may be assessed on a single or multiple classifier. Different metrics allow the evaluation of local performance when working within restricted ranges of sensitivity and specificity. For details on the different implementations, see McClish (1989), Vivo et al. (2018), Jiang et al. (1996), Franco & Vivo (2021), and Carrington et al. (2020). There is an Introduction and another vignette on Selecting condition of interest.
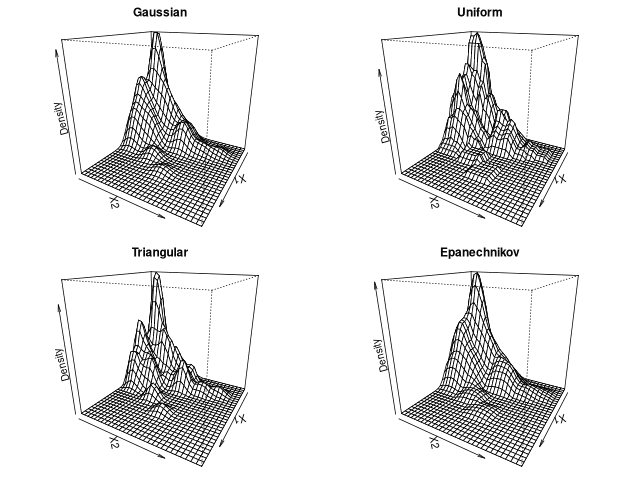
smoothemplik v0.0.15: Uses Rcpp to implement Kernel-based non-parametric methods for density and regression estimation and numerical routines for empirical likelihood maximization. See Kitamura, Tripathi & Ahn (2004) and Owen (2013) for background and the two vignettes Choosing Weights and Using Rcpp.
Time Series
calcal v1.0.0: Implements the algorithms described in Reingold and Dershowitz that allow conversion between many different calendar systems and calculate cultural and religious holidays. See the vignette.
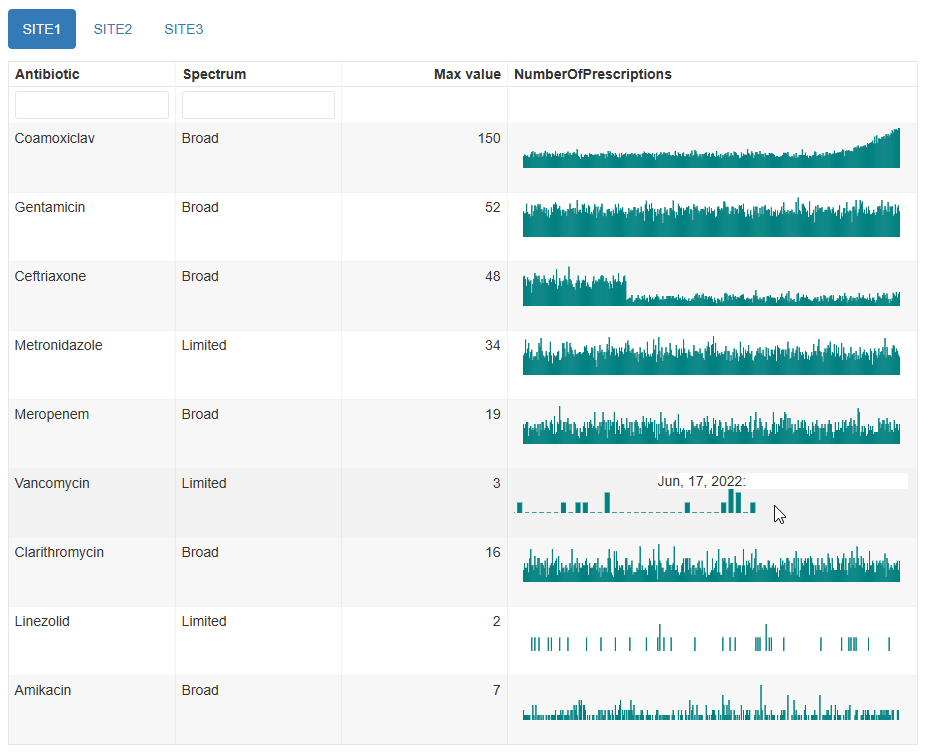
mantis v0.4.3: Provides tools to generate interactive html reports that enable quick visual review of multiple related time series. The reports are self-contained and shareable without a web server. There are three vignettes, including Get Started and Specifying Alerting Rules.
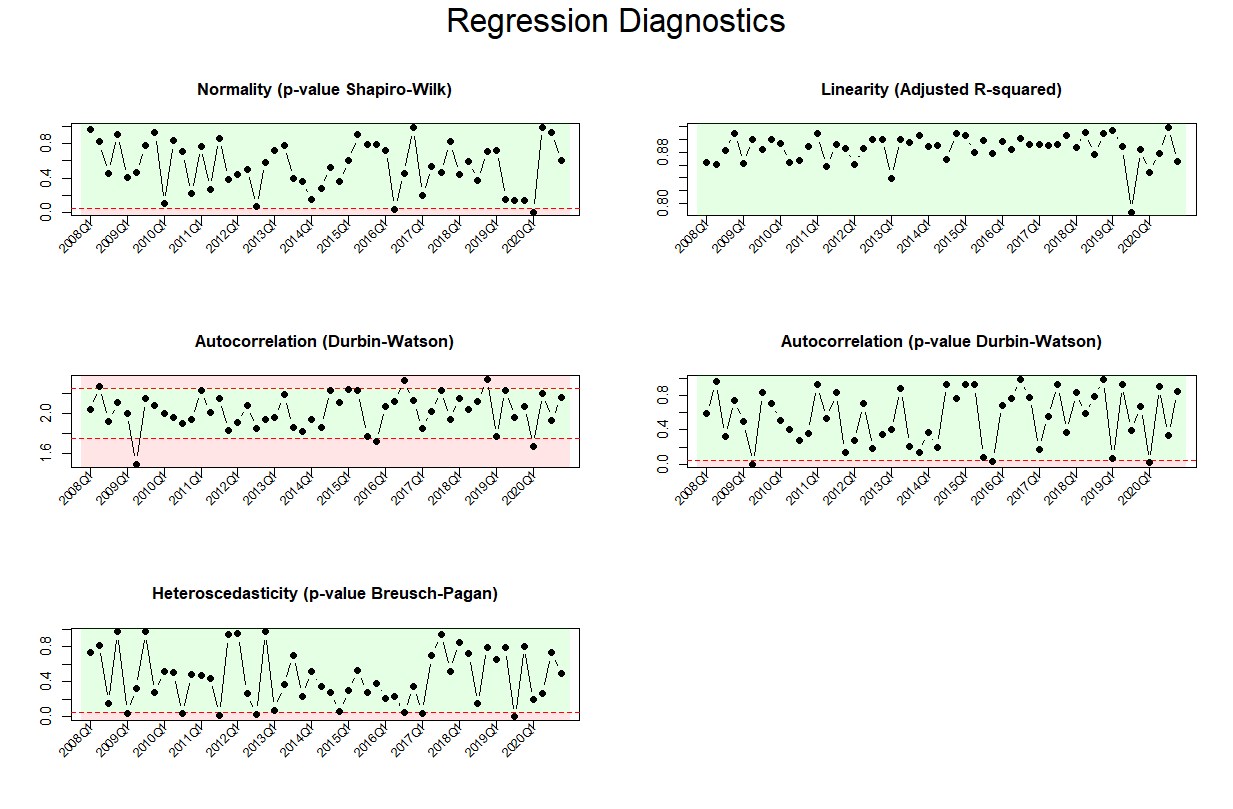
REPS v1.0.0: Provides functions to compute price indices using various Hedonic and multilateral methods, including Laspeyres, Paasche, Fisher, and HMTS (Hedonic Multilateral Time series re-estimation with splicing). Functions support index construction workflows across a wide range of domains, including but not limited to real estate, where quality-adjusted price comparisons over time are essential. The HMTS method implemented here is described in Ishaak, Ouwehand & Remøy (2024). See the vignettes Getting Started with Price Index Calculation and Regression Diagnostics by Period.
tEDM v1.0: Implements methods to infer causation from time series data through empirical dynamic modeling (EDM). Methods include convergent cross mapping from Sugihara et al., partial cross mapping as outlined in Leng et al. (2020), and cross mapping cardinality as described in Tao et al. (2023). See the vignette for examples.
Utilities
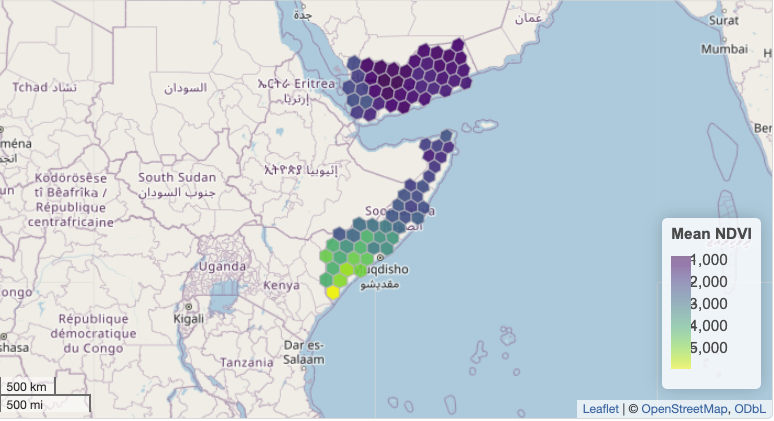
geeLite v1.0.2: Simplifies the creation, management, and updating of local databases using data extracted from Google Earth Engine (GEE) by providing tools that leverage SQLite to store, aggregate, and process spatio-temporal data. Utilities support real-time monitoring and analysis of geospatial features, making it suitable for researchers and practitioners in geospatial science. See Kurbucz & Andrée (2025) for details and the vignette for examples.
otel v0.1.0: Implements a collection of tools based on the OpenTelemetry API to instrument software to generate, collect, and export telemetry data (metrics, logs, and traces) to analyze the software and understand its performance and behavior. See README for an example.
qryflow v0.1.0: Provides functions to execute multi-step SQL workflows by leveraging specially formatted comments to define and control execution. This enables users to mix queries, commands, and metadata within a single script. There are three vignettes, including Getting Started and Advanced Usage.
staninside v0.0.4: Provides infrastructure and functions for integrating Stan code into standalone R packages, which, in turn, use the CmdStan engine. see the vignette.
Visualization
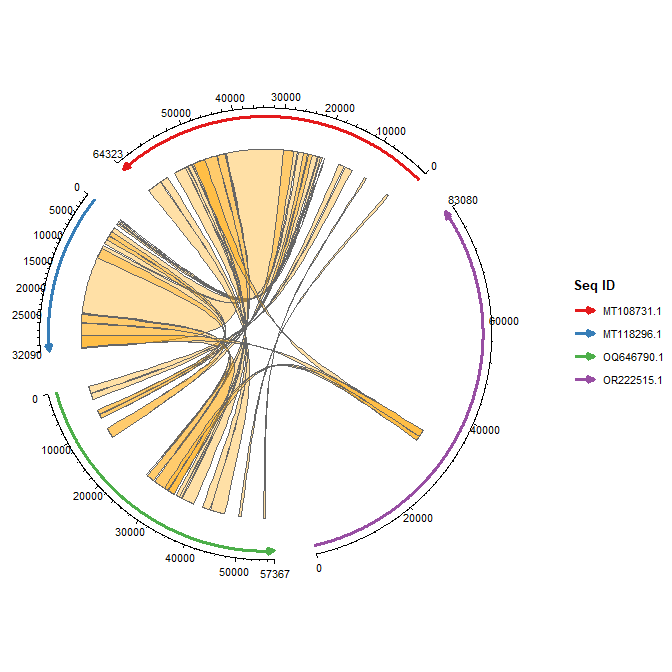
ggchord v0.2.0: Extends ggplot2 to visualize pairwise BLAST alignment results as chord diagrams, intuitively displaying homologous regions between query and subject sequences. See the vignette.
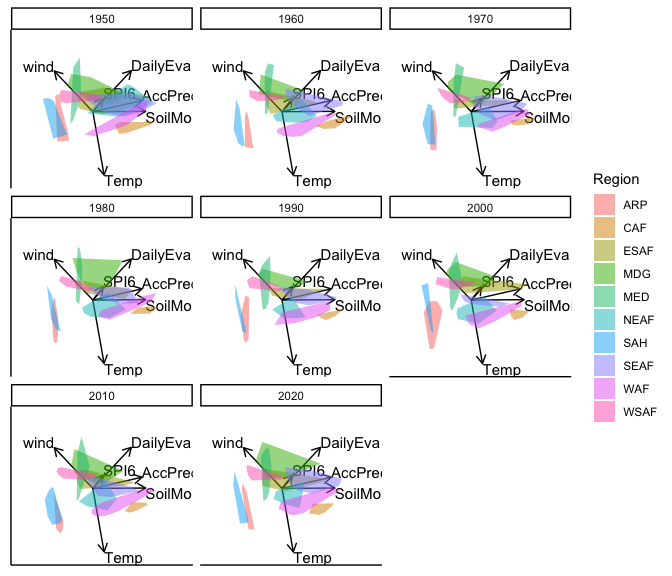
moveEZ v1.1.0: Provides functions to create animated biplots that enable dynamic visualization of temporal or sequential changes in multivariate data by animating a single biplot across the levels of a time variable. See the vignette.