Three hundred twenty-nine new packages were submitted to CRAN in July. Here are my Top 40 picks in nineteen categories: Agriculture, Artificial Intelligence, Climate Studies, Computational Methods, Ecology, Epidemiology, Genomics, Machine Learning, Medical Statistics, Meta-Analysis, Networks, Process control, Programming, Public Transit, Statistics, Surveys, Time Series, Utilities, and Visualization.
Agriculture
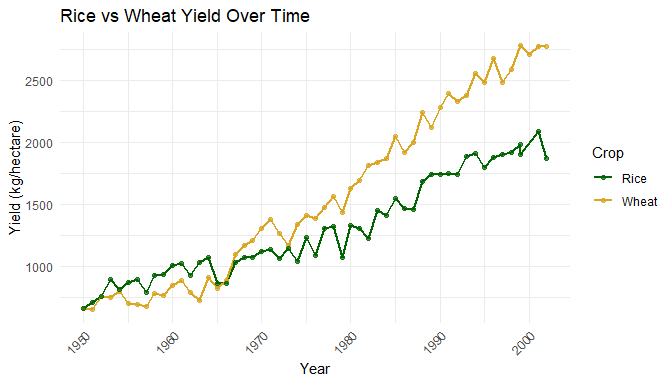
agridatasets v0.1.1: Offers a rich and diverse collection of datasets focused on agriculture, agronomy, animal science, and related fields. The package includes experimental, observational, and field-trial data on crops such as rice, wheat, corn, soybean, cotton, coffee, avocado, and orange, as well as forestry species including bamboo, eucalyptus, and timber. Datasets cover plant breeding and genetics, factorial and randomized block experiments, herbicide and insecticide efficacy trials, pest and disease infestation, soil characteristics and land suitability, plant growth regulators, seed germination, and crop yield modeling. See the vignette.
Artificial Intelligence
commons v0.1.0: Implements trustworthy large language model agents. Connect raw data sources, provides a pool of trusted calculations, and a searchable context layer that demonstrates how to interpret them. Then, deploy data agents that answer questions, log interactions, and can be evaluated and improved over time. See the vignettes Introduction and Security and governance.
diffuseR v0.2.2: A native R implementation of diffusion models providing a functional interface to state-of-the-art generative AI. Inspired by the Python library diffusers from Hugging Face, functions generate and manipulate images from text prompts using models such as Stable Diffusion, with no Python dependency. Supports multiple diffusion schedulers and device acceleration. See the vignette and README for more information.

Rhobots v0.1.10: Implements the BERTopic topic modeling pipeline directly in R: Provides transformer-based sentence embedding, uniform manifold approximation and projection dimensionality reduction, hierarchical density-based spatial clustering of applications with noise clustering, and class-based term frequency-inverse document frequency topic extraction without any dependency on Python, conda, or reticulate. Every stage runs in R through torch, safetensors, tok, uwot, and dbscan. The package mirrors the accessor API of the original Python package, adds integrated quality metrics and hyperparameter search tools, and introduces part-of-speech filtered and C-value-ranked representation models. See README for more information.
Climate Studies
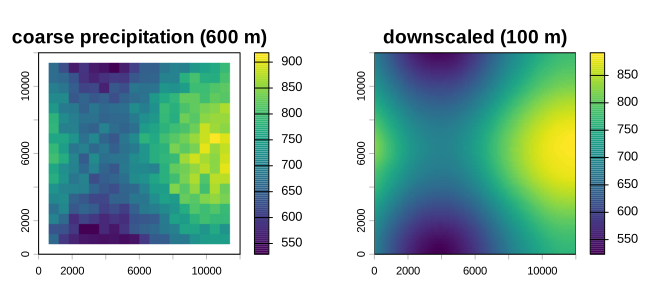
topocast v0.0.5: Downscales coarse-resolution raster data to a finer grid by fitting local linear regressions of a response, such as a climate variable, on one or more fine-resolution predictors, such as elevation and other terrain indices, within a moving window. Multiplicative and additive anomaly application downscale time series relative to a baseline climatology. Follows the regression-on-elevation approach used for high-resolution climate surfaces described in Karger et al. (2017). See the vignettes Getting started and How moving-window downscaling works.
Computational Methods
openfhe.R v1.5.1.1: Provides an R interface to penFHE, the open-source C++ library for fully homomorphic encryption Badawi et al. (2022), which allows computation directly on encrypted data without access to the secret key. Supports the Brakerski-Fan-Vercauteren (2012), Brakerski-Gentry-Vaikuntanathan (2014), and Cheon-Kim-Kim-Song (2017) schemes for arithmetic on encrypted numbers. There are three vignettes including Introduction and CKKS Bootstrapping.
Ecology
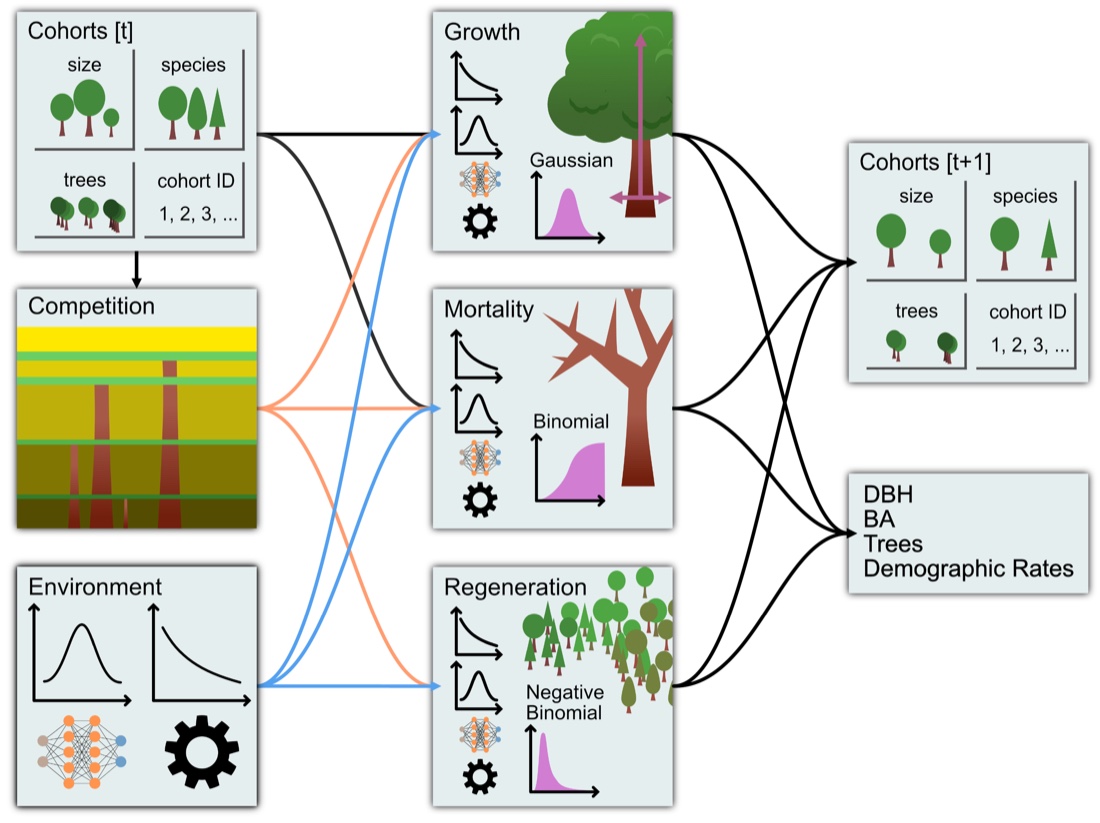
FINN v0.1.0: Implements a hybrid dynamic forest model that can be configured as a fully mechanistic, process-based model, like classic forest gap models, or with its demographic processes (growth, mortality, regeneration) replaced by deep neural networks, or any combination of the two. Provides functions to define a model and its mechanistic or empirical components, calibrate it to forest inventory data, and interpret the calibrated processes. FINN is implemented with the torch package but no knowledge of torch is required. The hybrid modeling approach is described in Pichler and Käber (2026). There are five vignettes including Introduction and Mortality: a binomial response and a neural-network process.
gbif.range v1.9.2: Implements an end-to-end workflow to generate ecologically informed species range maps from sparse observations using environmental clustering and convex hulls. Serves as a standalone framework or complementary approach to species distribution models. By constraining estimated ranges within authoritative or custom ecoregion boundaries, the approach prevents spurious range over-prediction common in geometric hull methods. There are five vignettes including Getting Started and Part 2: Ecoregion-Based Range Inference.
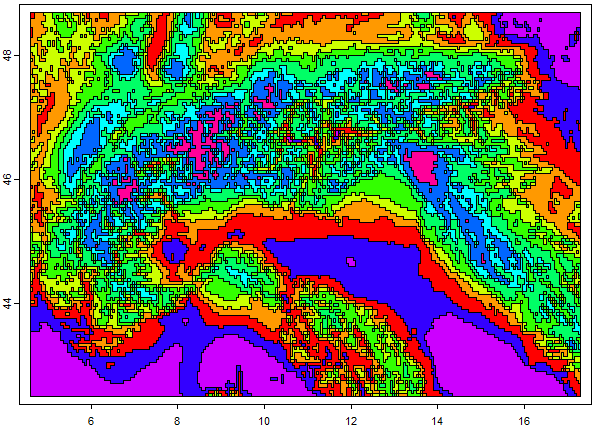
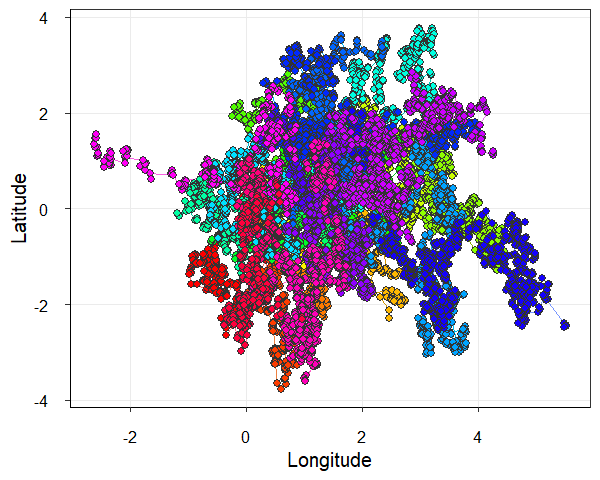
PhysMove v1.2.5: Provides tools to analyse animal movement and space-use patterns from telemetry data using methods derived from statistical physics. Methods span displacement-based approaches, distribution fitting, space-use metrics, including the influence of correlations on space-use, network-based community detection, and measures of entropy and predictability. The package enables characterization of these patterns across spatial and temporal scales. For applications of these methods in ecological studies see Rodríguez et al. (2017) and Sequeira et al. (2018). There are four vignettes including Introduction and Movement Patterns.
Epidemiology
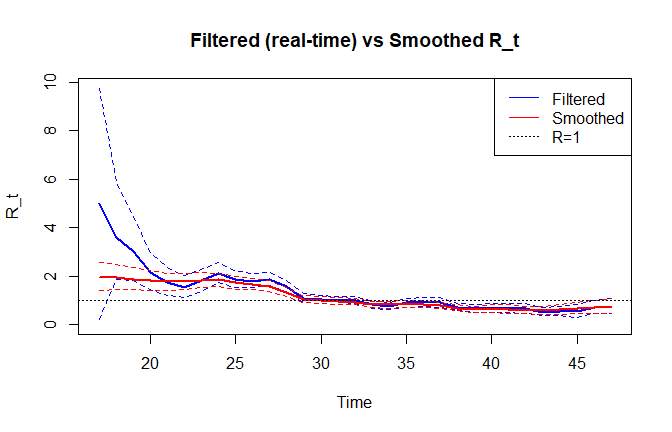
RtForecastR v0.1.1: Provides functions for filtered (real-time/causal) and smoothed (retrospective) estimation of the time-varying effective reproduction number from case-count time series, using the EpiFilter algorithm of Parag (2021), together with a one-step-ahead in-sample prediction check, a genuine out-of-sample one-step forecast with predictive intervals, elimination probability \(P(R_t < 1)\), and forecast calibration metrics. See the vignette.
Genomics
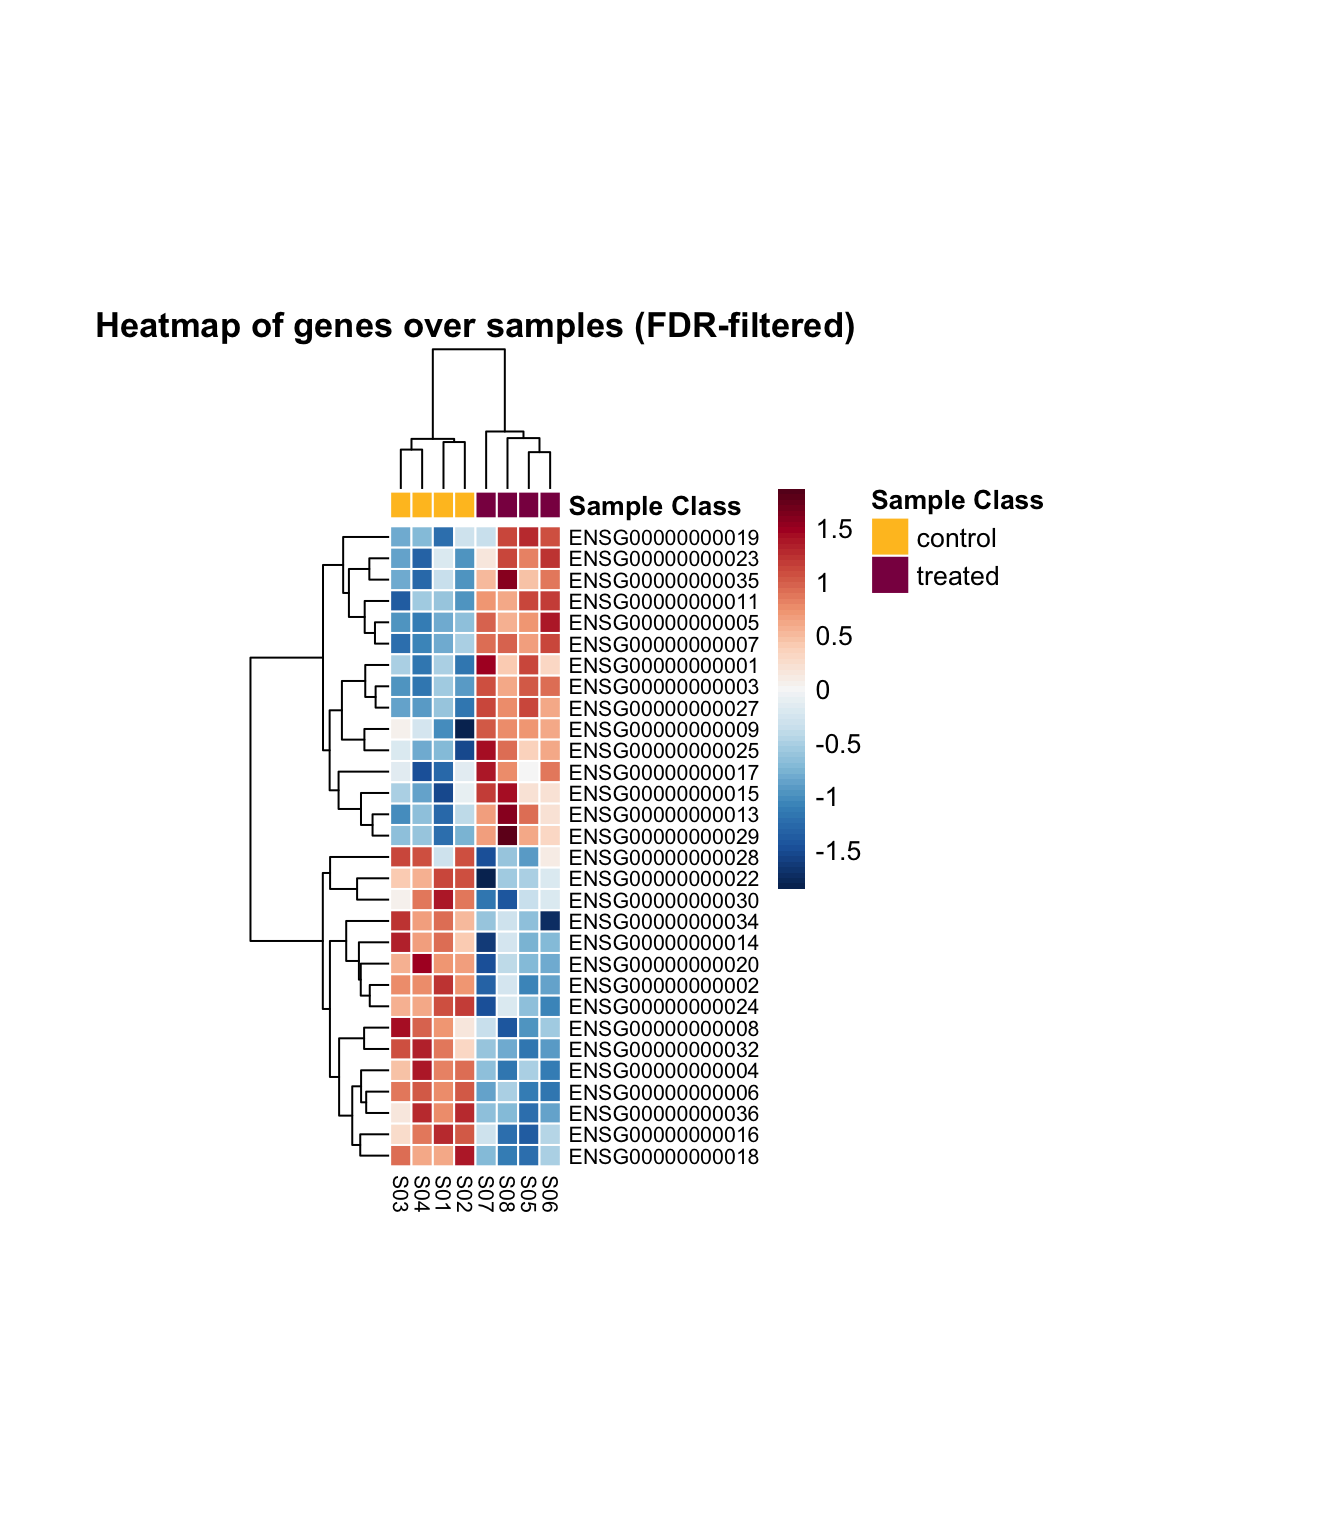
diffwrap v0.6-3: Provides functions for differential expression analysis of read counts from messenger RNA (mRNA) sequencing (RNA-Seq) data or micro RNA (miRNA) expression values generated by the Comprehensive Analysis Pipeline for microRNA Sequencing expression_reports.sh script. The workflow follows the Bioconductor edgeR-limma expression data analysis pipeline providing options for different approaches, such as pure edgeR, voom or paired samples. Methods are described in Robinson, McCarthy and Smyth (2010), Ritchie et al. (2015), Law et al. (2014 and Sun et al. (2014). See the vignette.
Machine Learning
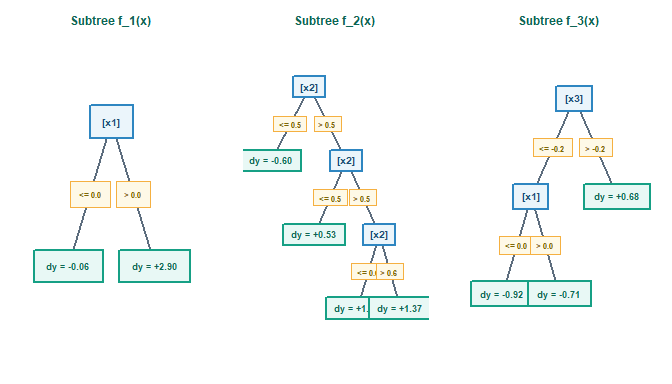
figsr v0.1.1: Implements a flexible, interpretable machine learning algorithm for additive tree sums. Fits a sum of shallow classification and regression trees (CART) by greedily minimizing residual impurity, growing a new tree or deepening an existing one at each step, whichever reduces the residuals most. Supports regression and two-class classification, variable importance, bootstrap ensembling and seamless integration with parsnip and tidymodels workflows. The method is described in Tan et al. (2023). See the vignette.
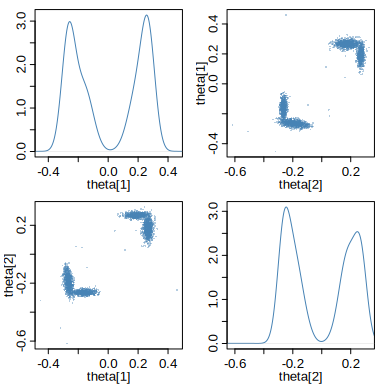
neuralsbi v0.3.2: Provides a native R implementation of a neural simulation-based estimator that runs on the torch back end and is focused on Neural Posterior Estimation. Given a prior over parameters and a simulator, functions train a conditional neural density estimator to approximate the Bayesian posterior, enabling amortized, likelihood-free inference. It targets applied researchers who want an approachable interface with sensible defaults and built-in posterior diagnostics. There are four vignettes including Getting started and Case study: inferring epidemic parameters (SIR).
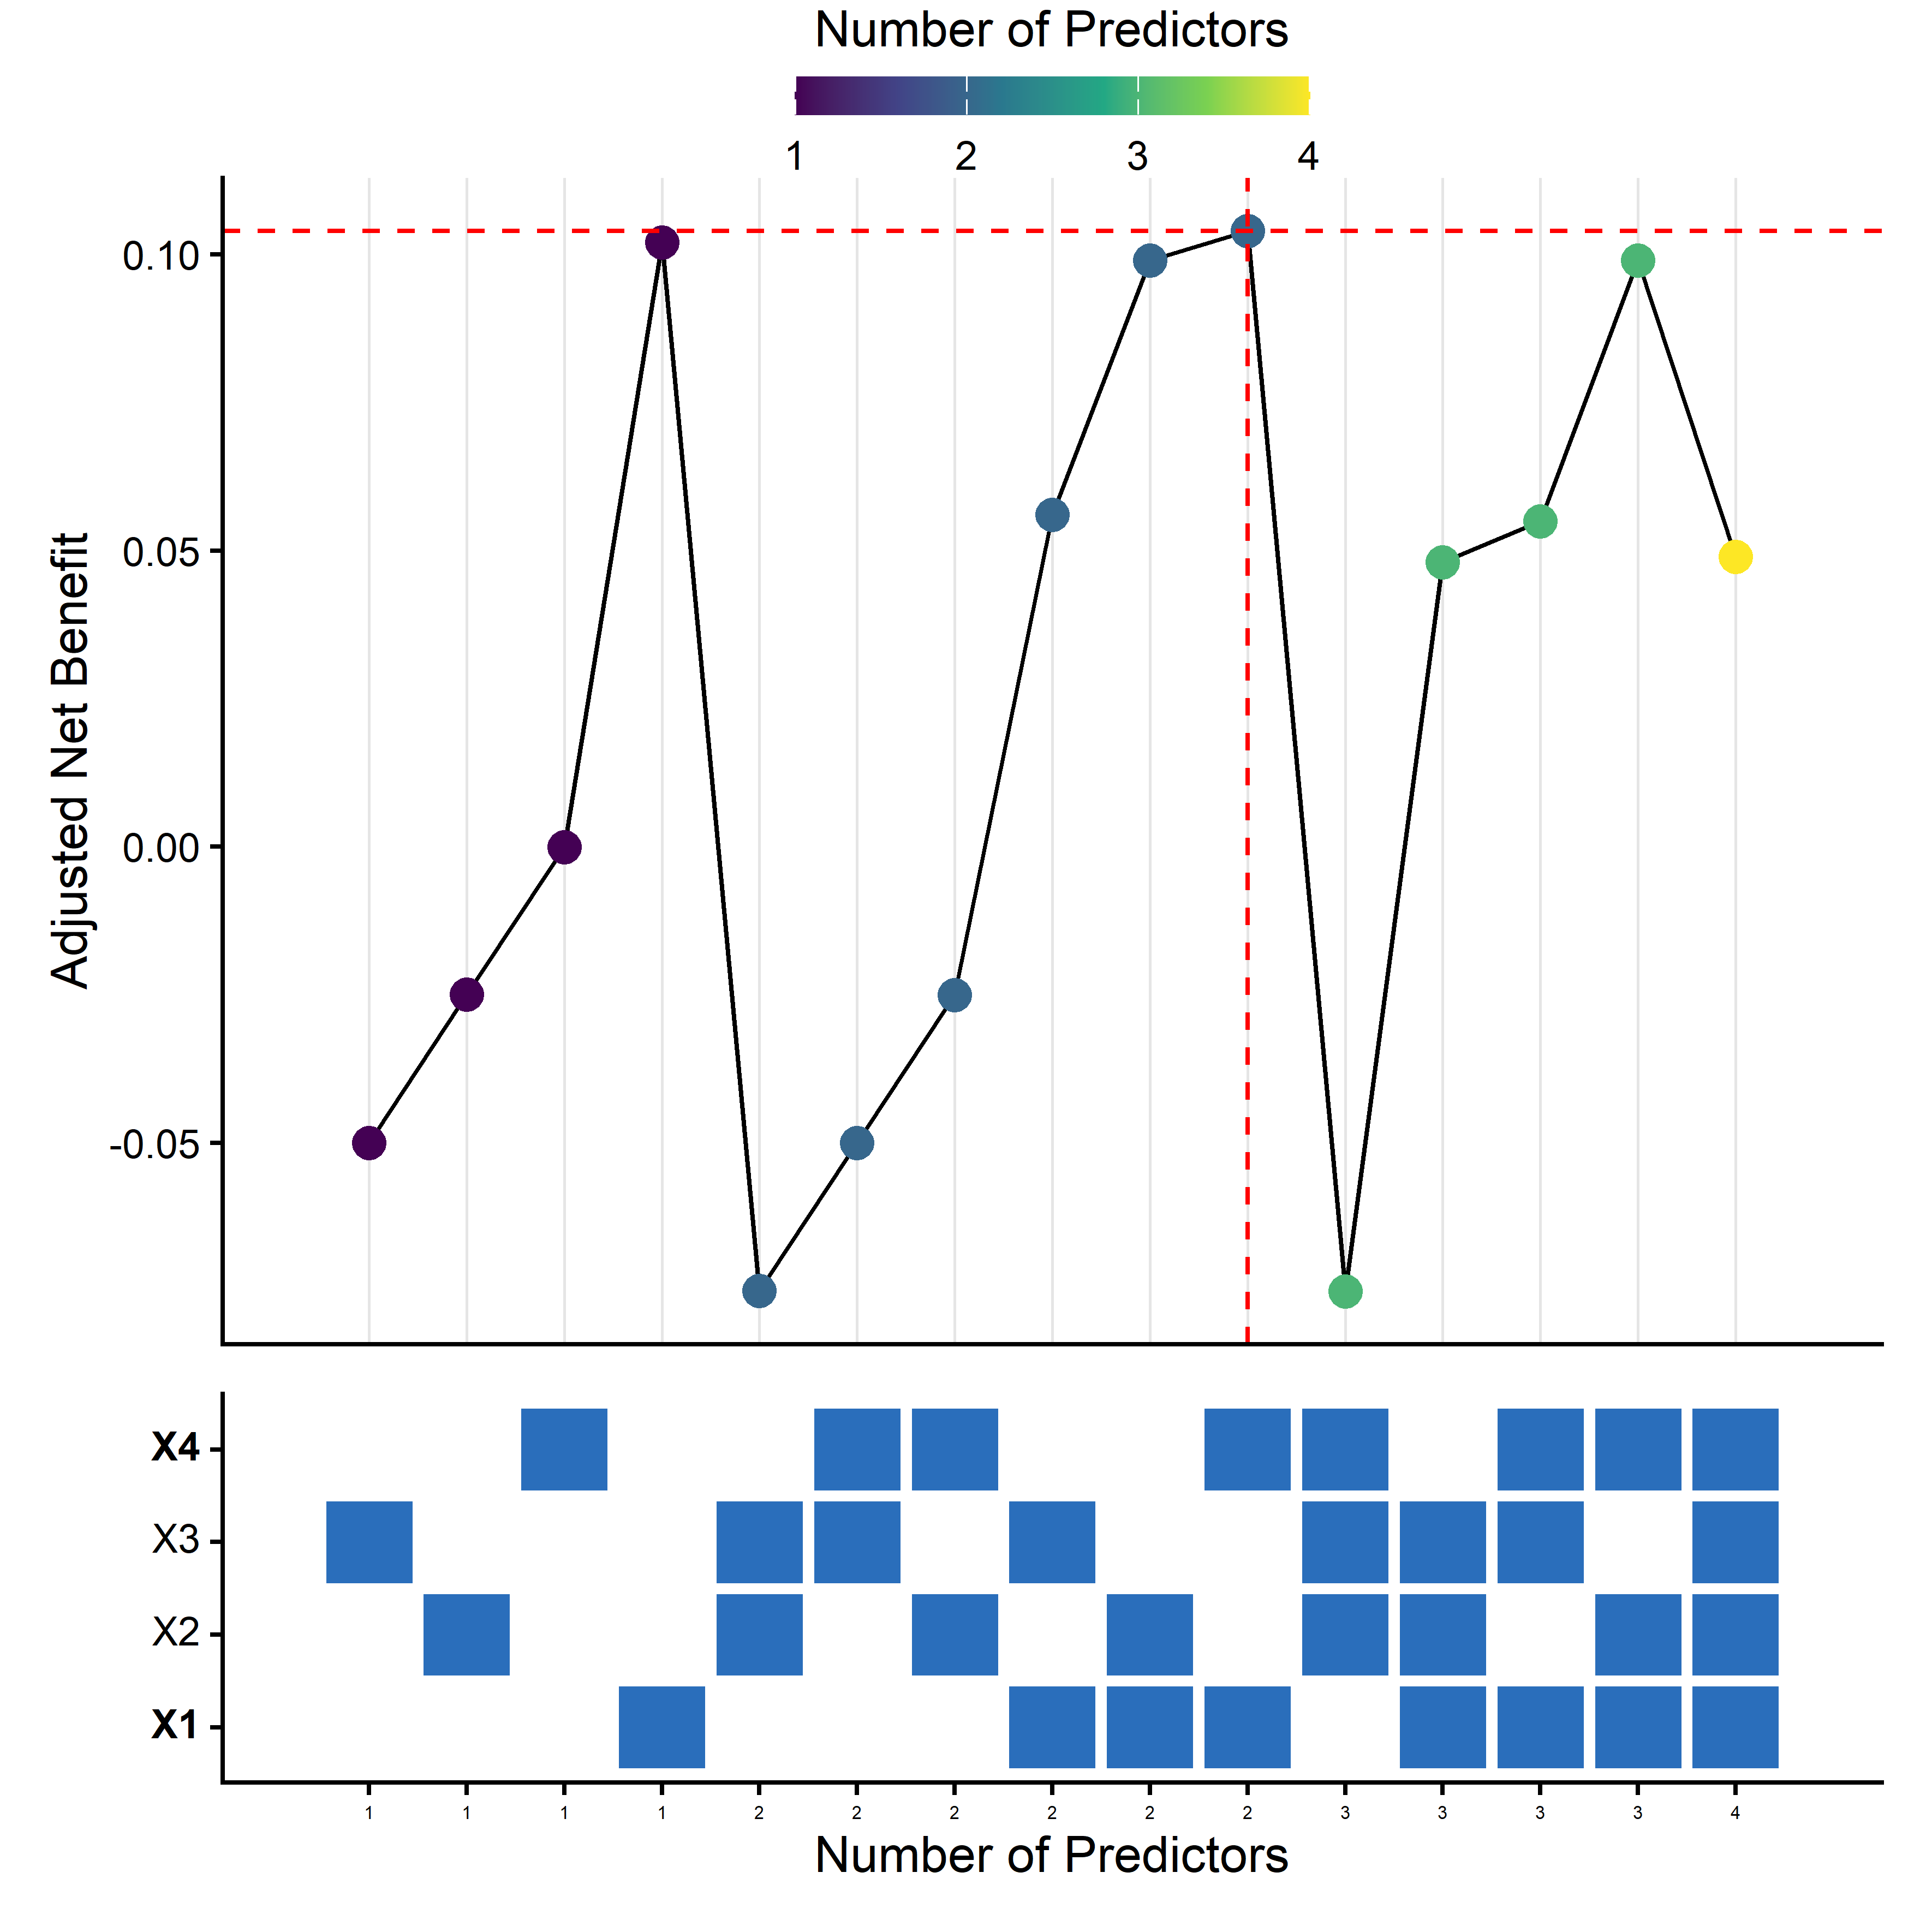
NBvarsel v0.1.1: Performs exhaustive or groupwise (backward elimination) variable selection for binary outcome prediction models using cross-validated net benefit as the optimization criterion. It supports predictor costs, restricted cubic splines, interaction terms, permutation importance, and parallel computation. It includes visualizations for model comparison and variable importance. References include Vickers & Elkin (2006) and Van Calster et al. (2018). See the vignette.
Medical Statistics
CausalState v0.10.2: Implements sequential doubly robust and infinite-dimensional targeted maximum likelihood estimators for longitudinal modified treatment policies in settings with transitioning states, such as ICU, ward, or emergency department care episodes. Treatment is permitted in active states and becomes structurally inapplicable after a state transition (e.g. discharge or death). Methods based on Diaz et al. (2021) and Luedtke et al. (2017). There are three vignettes including Getting started and Wu-Benkeser density-ratio metalearner.
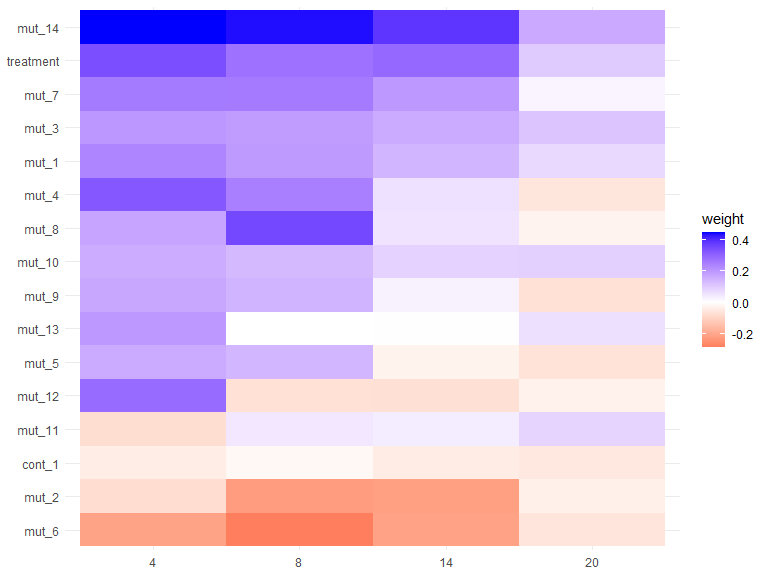
orthoMTL v0.1.0: Fits regularized multi-task learning models where relationships between tasks are controlled via orthogonality or disjoint-support constraints. Supports regression, binary classification, and censored survival data. In survival mode, time-to-event outcomes are converted into binary labels at user-defined thresholds, enabling the discovery of features with time-varying effects that standard proportional-hazards models cannot detect. Implements the penalty described in Vervier et al. (2014). See the vignette.
expoquimR v0.1.0: Provides a unified toolkit for occupational chemical exposure risk assessment, implementing three internationally recognized methods: the qualitative control-banding methods COSHH Essentials (UK Health and Safety Executive) and the method of the French National Research and Safety Institute (INRS), together with the quantitative statistical procedure of the UNE-EN 689 standard for comparing measured exposure levels against occupational exposure limits. Every step of each method is implemented as a small, independently callable, and unit-tested function, so assessments are reproducible and auditable. Optional shiny applications provide a guided, interactive workflow. References: UK Health and Safety Executive (2003) and Mallet, Pilorget and Berne (2013), ISBN:978-2-7389-2166-2. There are three vignettes including COSHH Essentials: Qualitative Chemical Risk Assessment and INRS Method: Qualitative Inhalation Risk Assessment
rdborrow v0.0.4.0: Implements causal inference methods for incorporating external control data into randomized controlled trials with longitudinal outcomes. Provides an analysis module supporting weighting-based methods such as inverse probability weighting and augmented inverse probability weighting, difference-in-differences. Methods are based on Zhou et al. (2024) and Zhou et al. (2024). There are five vignettes including Introduction and Primary Analysis Workflow.
Meta Analysis
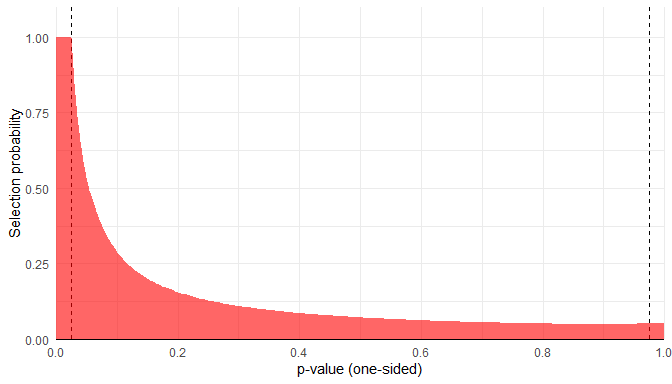
metaselection v0.3.0: Fits a flexible class of p-value selection models for meta-analysis and meta-regression models, providing standard errors and confidence intervals based on either cluster-robust variance estimators (i.e., sandwich estimators) or cluster-level bootstrapping to handle dependent effect size estimates, as described in Pustejovsky, Citkowicz, and Joshi (2025) and Citkowicz, Pustejovsky, and Joshi (2026). Supported models include generalizations of the step-function selection model as proposed by Vevea and Hedges (1995) and the beta-function selection model as proposed by Citkowicz and Vevea (2017). See the vignette.
Networks
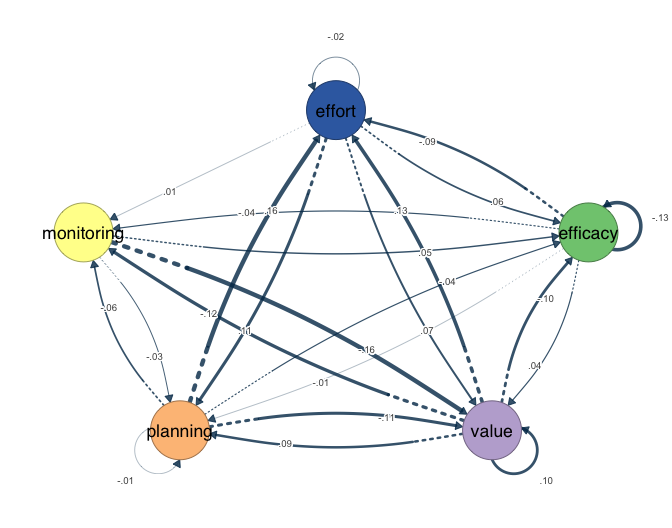
idiographic v0.3.4: Provides functions to make person-specific and within-person network estimation from intensive longitudinal and panel data. Estimators include ordinary vector autoregression (VAR), graphical vector autoregression, multilevel vector autoregression, rolling ordinary and graphical VAR, native Bayesian VAR, multilevel Bayesian VAR, unified Structural Equation Modeling, and Group Iterative Multiple Model Estimation. Methods are described in Saqr et al. 2025 and Epskamp et al. (2018). There are seven vignettes including an introduction and Multilevel VAR.
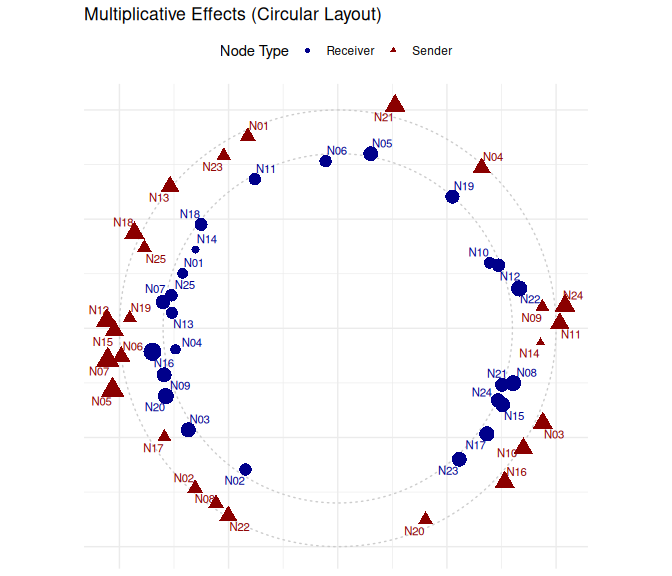
lame v1.3.4: Implements additive and multiplicative effects models for both cross-sectional and longitudinal network analysis and supports square and rectangular network structures. Key features include: (1) Cross-sectional network analysis with support for binary, continuous, ordinal, and count data; (2) Longitudinal network analysis with additive sender/receiver and multiplicative latent-factor effects that can evolve over time through AR(1) processes’ (Sewell and Chen (2015) and Durante and Dunson (2014)); (3) Handling of changing actor compositions across time periods in longitudinal models; and (4) Performance improvements. There are seven vignettes including Overview and Getting Started.
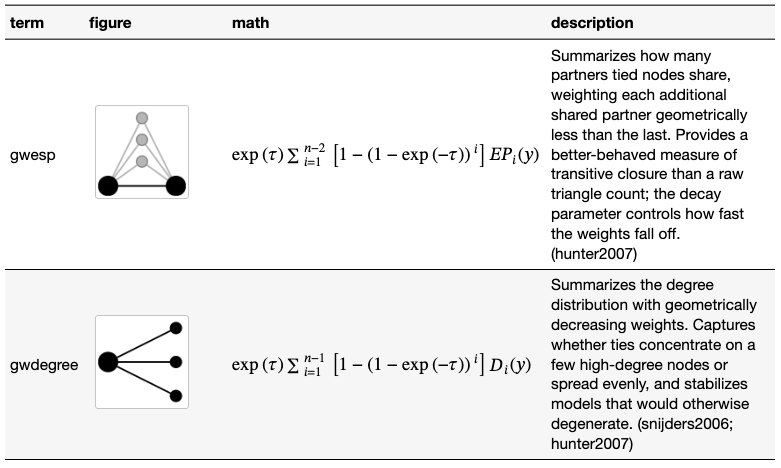
tabulergm v0.1.0: Creates publication-ready tables documenting exponential-family random graph models (ERGMs), a class of statistical models for social networks (Robins et al. (2007)). Tables describe model terms through their definitions, mathematical representations, and graphical representations, and can be generated from ERGM formulas or from models fitted with the ergm package (Hunter et al. (2008). Resulting tables can be integrated into quarto and rmarkdown documents.
Process Control
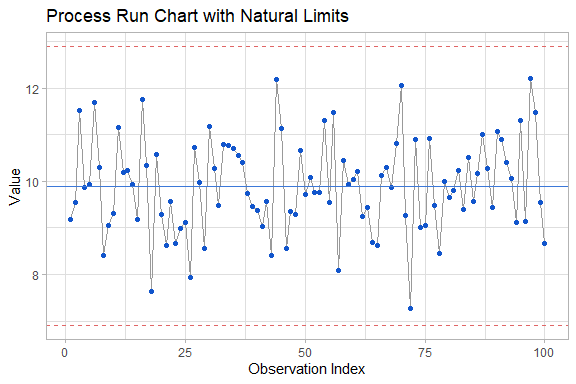
gpci v0.1.0: Implements a comprehensive, generalized framework for computing, estimating, and validating generalized process capability indices. Supports user-supplied probability density functions, cumulative distribution functions, survival functions, and quantile functions with uncensored data parameter estimation via Maximum Likelihood Estimation. Provides several classical and non-normal capability indices, including Cpy (Maiti, Saha and Nanda, (2010), Spmk (Dey and Saha (2019), CpTk (Saha, Dey and Maiti (2019) and others. Functions also compute parametric and non-parametric bootstrap confidence intervals, confidence levels using percentile, highest posterior density intervals and Heidelberger-Welch convergence diagnostics. See Maiti, Saha and Nanda (2010) and Saha, Dey and Maiti (2018) for background. See the vignettes Getting Started and Using Custom Distributions.
Programming
polyglotSQL v0.1.0: Provides functions to parse, tokenize, validate, format, analyze and translate SQL between more than 30 dialects (PostgreSQL, MySQL, BigQuery, Snowflake, DuckDB, T-SQL, and others) using polyglot-sql Rust crate. All processing happens locally in the R session. Includes column-level lineage, structural query analysis, query optimization, AST diffing and OpenLineage facet generation. There are four vignettes including Getting Started and Parsing, validation and lineage.
Public Transit
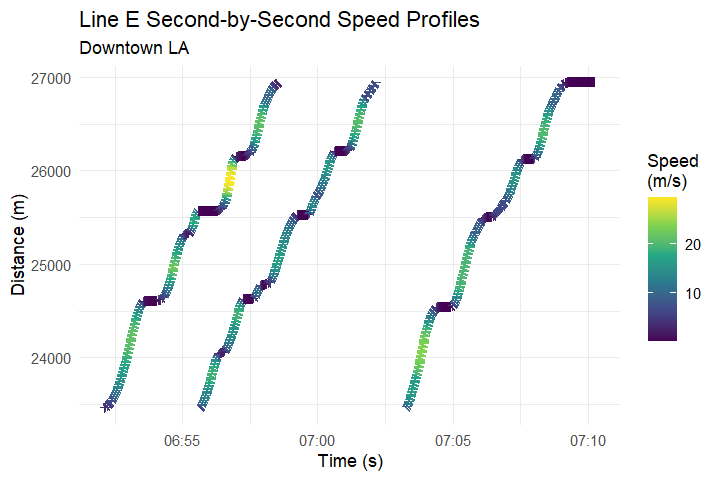
transittraj v1.1.0: Today’s public transit vehicles produce a large amount of automatic vehicle location (AVL) data which is very useful for planning and performance studies, but can be noisy, error-prone, and sparse. This package provides tools for cleaning AVL point data and turning it into continuous, differentiable, monotonic, and invertible vehicle trajectory functions, based on the work of Robbennolt et al. (2025) and Huang et al. (2023). See the vignettes Introduction and The AVL Cleaning Workflow.
Statistics
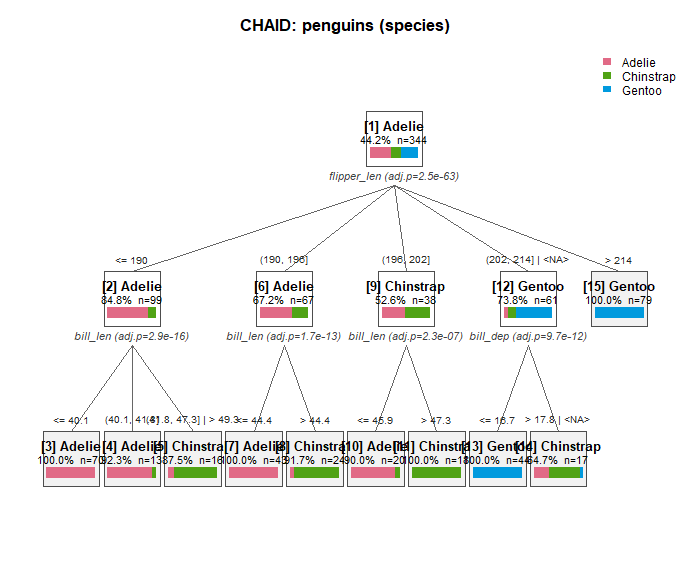
chaidr v0.1.0: Implements the CHAID (Chi-squared Automatic Interaction Detection) decision tree algorithm of Kass (1980) and the Exhaustive CHAID variant of Biggs, de Ville, and Suen (1991), as specified in the IBM SPSS Statistics Algorithms documentation. Supports nominal, ordinal with floating missing category, and continuous predictors, and nominal, ordinal, and continuous response variables using Pearson chi-squared, Goodman row-effects, and one-way ANOVA F tests respectively. Includes prediction, rule extraction, gains and lift analysis, validation on holdout data, and visualization via base graphics, Graphviz DOT, plotly, and conversion to partykit objects. See the Introduction and the Japanese tutorial.
citcdf v1.1.0: Enables complex hypothesis testing through conditional cumulative distribution function estimation. Method is detailed in: Gauthier et al. (2021). See the vignette.
falsifyr v1.0.0: Attacks fitted R model claims by searching for small plausible perturbations that make a target result disappear. The package focuses on claim-level fragility, smallest-kill reporting, and reproducible caveated robustness checks for ordinary fitted model objects. The methods draw on the fragility-index concept of Walsh et al. (2014), multiverse analysis of Steegen et al. (2016), specification-curve analysis of Simonsohn et al. (2020), and robust covariance estimation of Zeileis (2004). See the vignettes Attacking a Regression Claim and Interpreting Survival Scores.
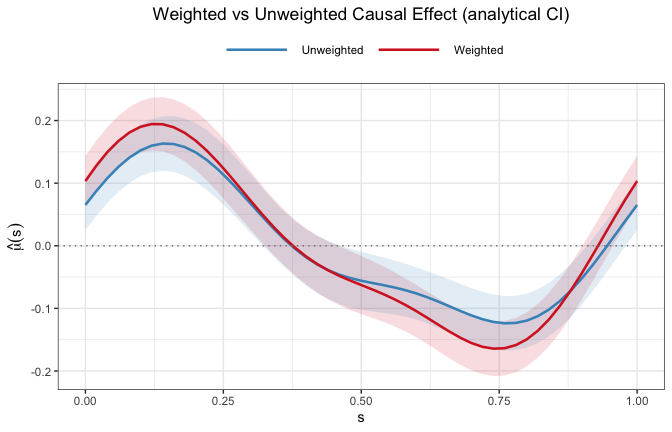
FPScausal v0.1.1: Implements functional propensity score weighting for causal inference with functional treatments. The method estimates weights that balance observed confounders by removing their dependence on the functional treatment and uses a dual formulation of the weighting problem for efficient unconstrained optimization. The framework supports scalar, binary, and functional outcomes, as well as functional covariates, and can be used to estimate marginal causal effects in settings with time-varying exposures. The methodology follows Ciardulli et al. (2026). See the vignette.
LRErdd v0.1.0: Provides functions for the design and analysis of Regression Discontinuity Designs as local randomized experiments within the potential outcome approach as formalized in Li, Mattei and Mealli (2015) including functions to implement the design phase of the study, where the focus is on the selection of suitable subpopulations for which valid causal inference can be drawn. These functions provide summary statistics of pre- and post-treatment variables by treatment status and select suitable subpopulations around the threshold where pre-treatment variables are well balanced between treatment groups. See the vignette. There is also a Shiny application.
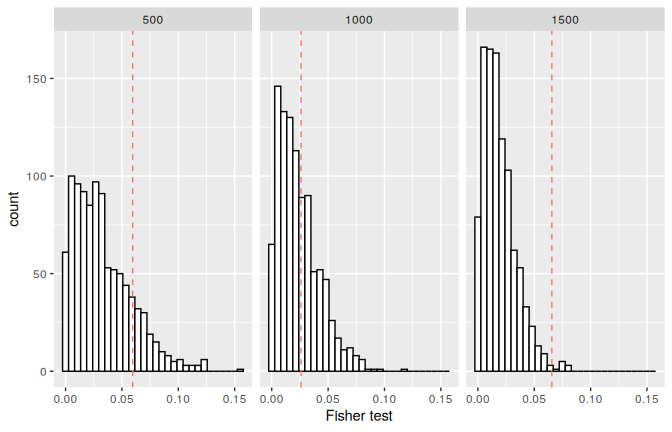
mvboxcox v0.1.4: Fits bivariate logistic Box-Cox regression models for binary outcomes and positive continuous predictors. Transformation parameters are selected by cross-validated grid search with adaptive refinement and thin-plate spline smoothing. The package also provides prediction, empirical and sampling-weighted median effects, simulation tools, and sampling-weighted model fitting. The methodology extends the logistic Box-Cox approach of Xing et al. (2021). See the vignette.
Surveys
sondage v0.9.1: Implements survey sampling algorithms for single-stage probability sampling from finite populations, written in C. Provides equal probability methods (simple random sampling, systematic, Bernoulli), unequal probability methods (conditional Poisson / maximum entropy, Sampford, Brewer, systematic PPS, Pareto, sequential Poisson, Poisson, Chromy’s minimum replacement, multinomial), balanced sampling via the cube method, and spatially balanced sampling via the local pivotal method and spatially correlated Poisson sampling. Functions compute joint inclusion probabilities, pairwise expectations, and sampling covariances for variance estimation. See Tillé (2006) for background. There are two vignettes Getting Started and Extending sondage with Custom Methods.
Time Series
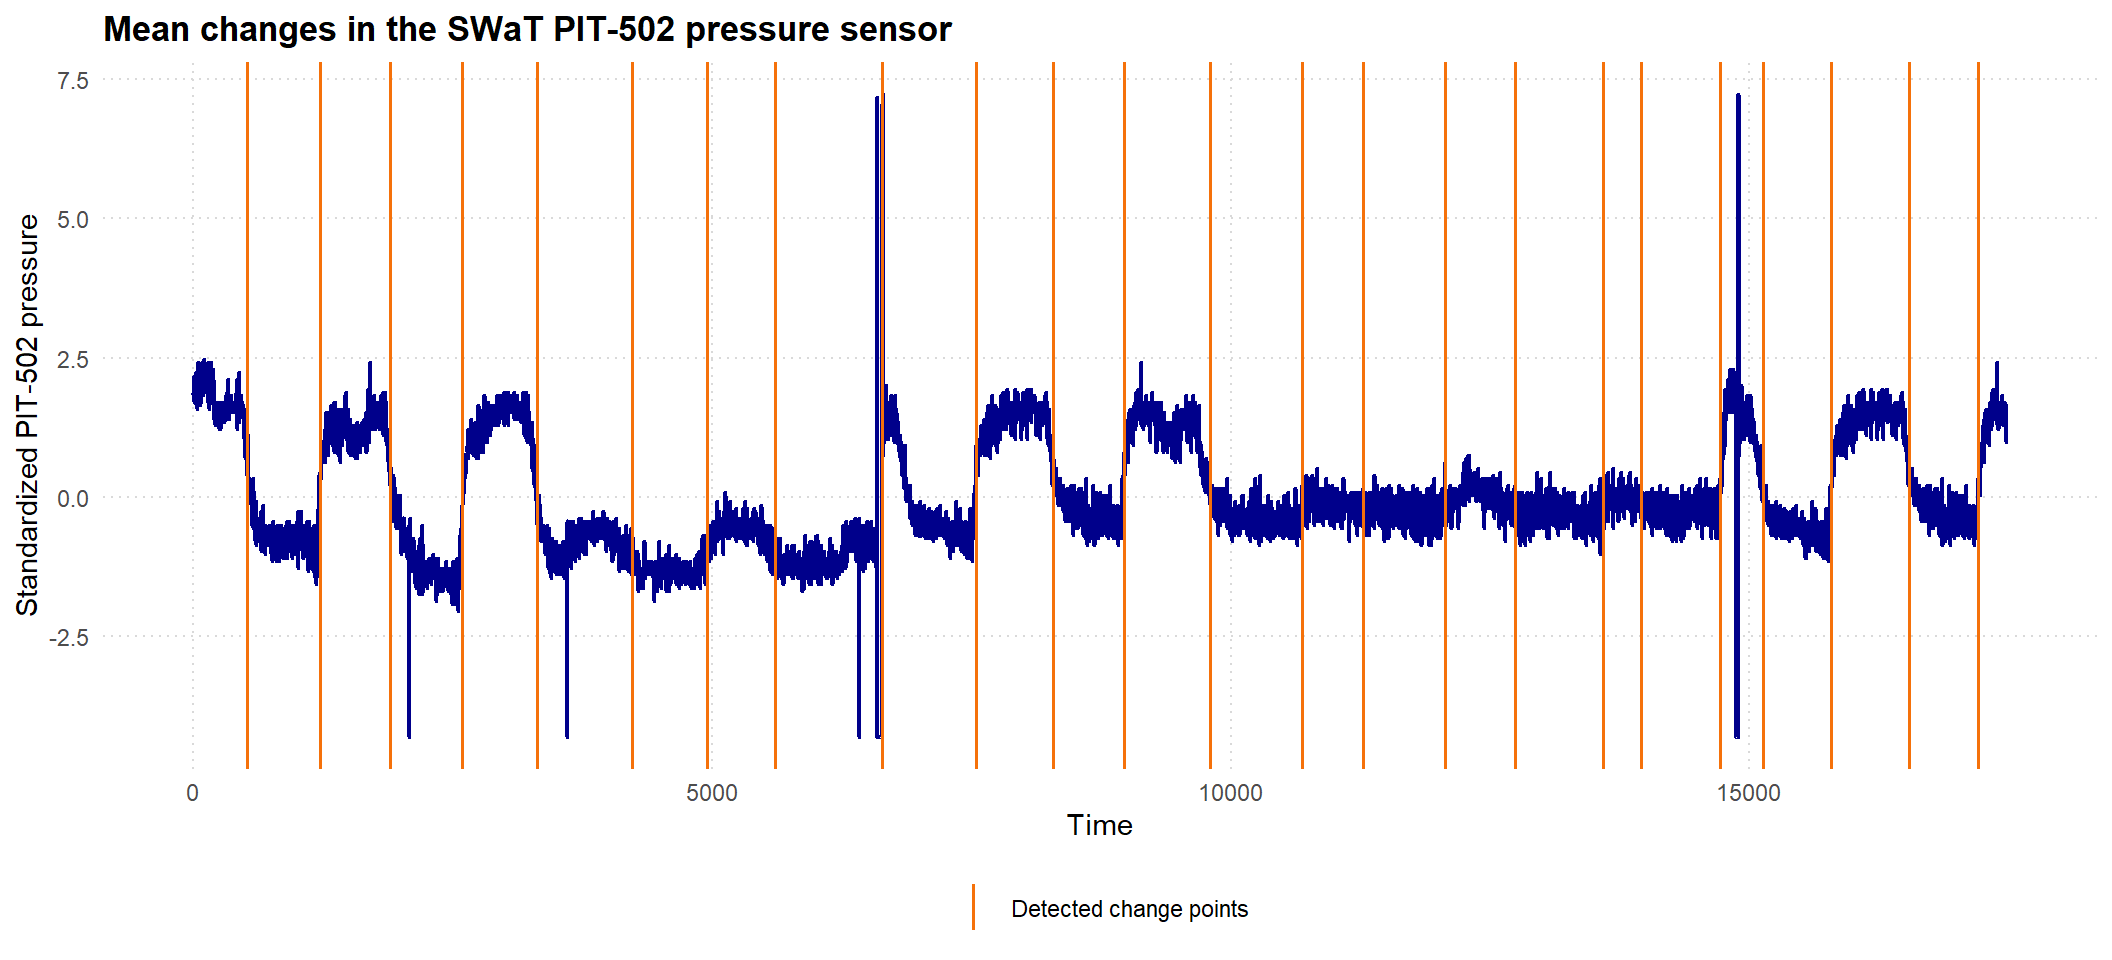
scanr v0.1.1: Detects change points in long univariate time series using the SCAN framework. The implementation uses a native Rust backend exposed to R via extendr. See the vignette.
Utilities
rmoriebricklayer v0.5.1: Tools for building brick-proof, reproducible, self-contained data capsules. Resolves open-data sources through the Comprehensive Knowledge Archive Network package_showand package_search endpoints, records and verifies provenance with Secure Hash Algorithm 256 (SHA-256) digests and Internet Archive Wayback Machine snapshots, validates downloaded data against a pinned schema. Run records are captured in a manifest plus a plain-language summary so any result can be traced back to its inputs. Tests distributional drift between a pinned capsule and a fresh fetch because a re-released extract can be statistically identical yet differ byte-for-byte. Manifests can be authenticated with keyed digests (HMAC-SHA-256, RFC 2104) or post-quantum hash-based signatures. There are eight vignettes including Building reproducible data capsules and Provenance you can verify.
scimesh v0.4.0: Implements a fast, GPU-free 3D software renderer written in modern C++17 with native R bindings. Renders triangle meshes to publication-quality images entirely on the CPU, requiring no display server or graphics hardware. Features multi-light Blinn-Phong shading, screen-space ambient occlusion, anti-aliasing, depth fog, transparency, wireframe rendering, texture mapping, screen-space lines and text labels, and procedural geometry generation. Supports standard mesh file formats with PNG and PPM output. Works on high-performance computing clusters, headless servers, containers, and continuous integration pipelines, making it suitable for scientific visualization across neuro-imaging, molecular structures, and general 3D graphics. See the vignette.
Visualization
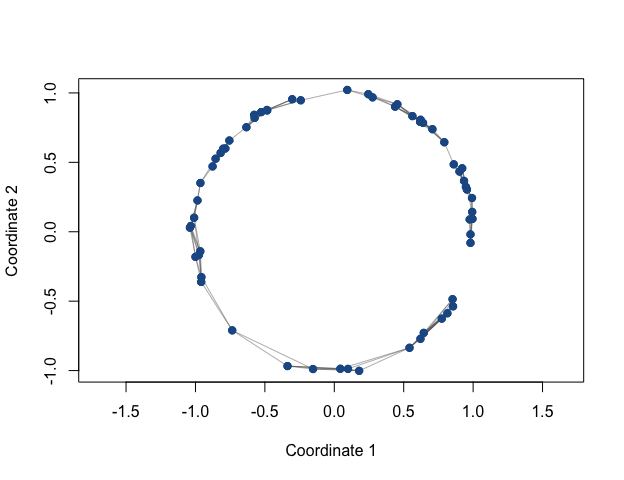
dgraphs v0.2.0: Constructs data-derived graphs from numerical observations using mutual, shared-neighbor, intersection, geodesic, radius, adaptive-radius, and minimum-spanning-tree completion methods. Provides graph conversion, pruning, diagnostics, spectral embedding, endpoint detection, and path utilities. The implemented graph constructions include methods described by Jarvis and Patrick (1973), Brito et al. (1997), Berry and Sauer (2019), and Gower and Ross (1969). See the vignette.
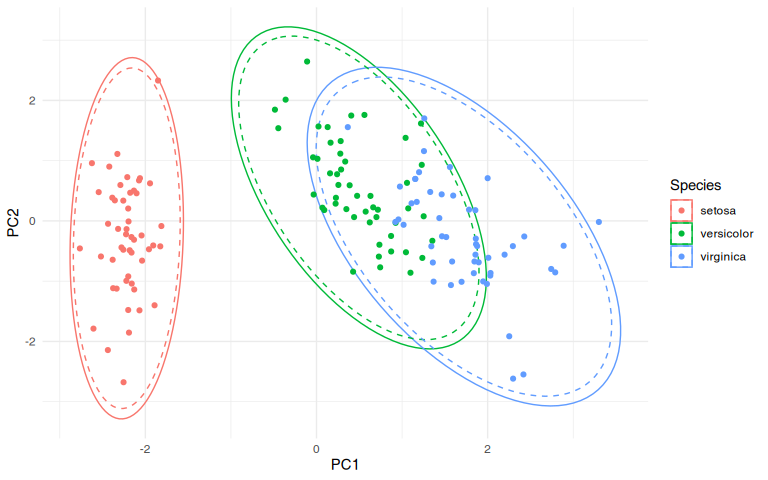
gghotelling v0.2.1: Calculate Hotelling’s T² ellipses and detect multivariate outliers both for base R plots and ggplot2 plots. Optionally, uses robust covariance estimation to reduce the influence of outliers on the ellipses. Also included: bagplots, kernel density plots and outlier diagnostic plots. See the vignette.
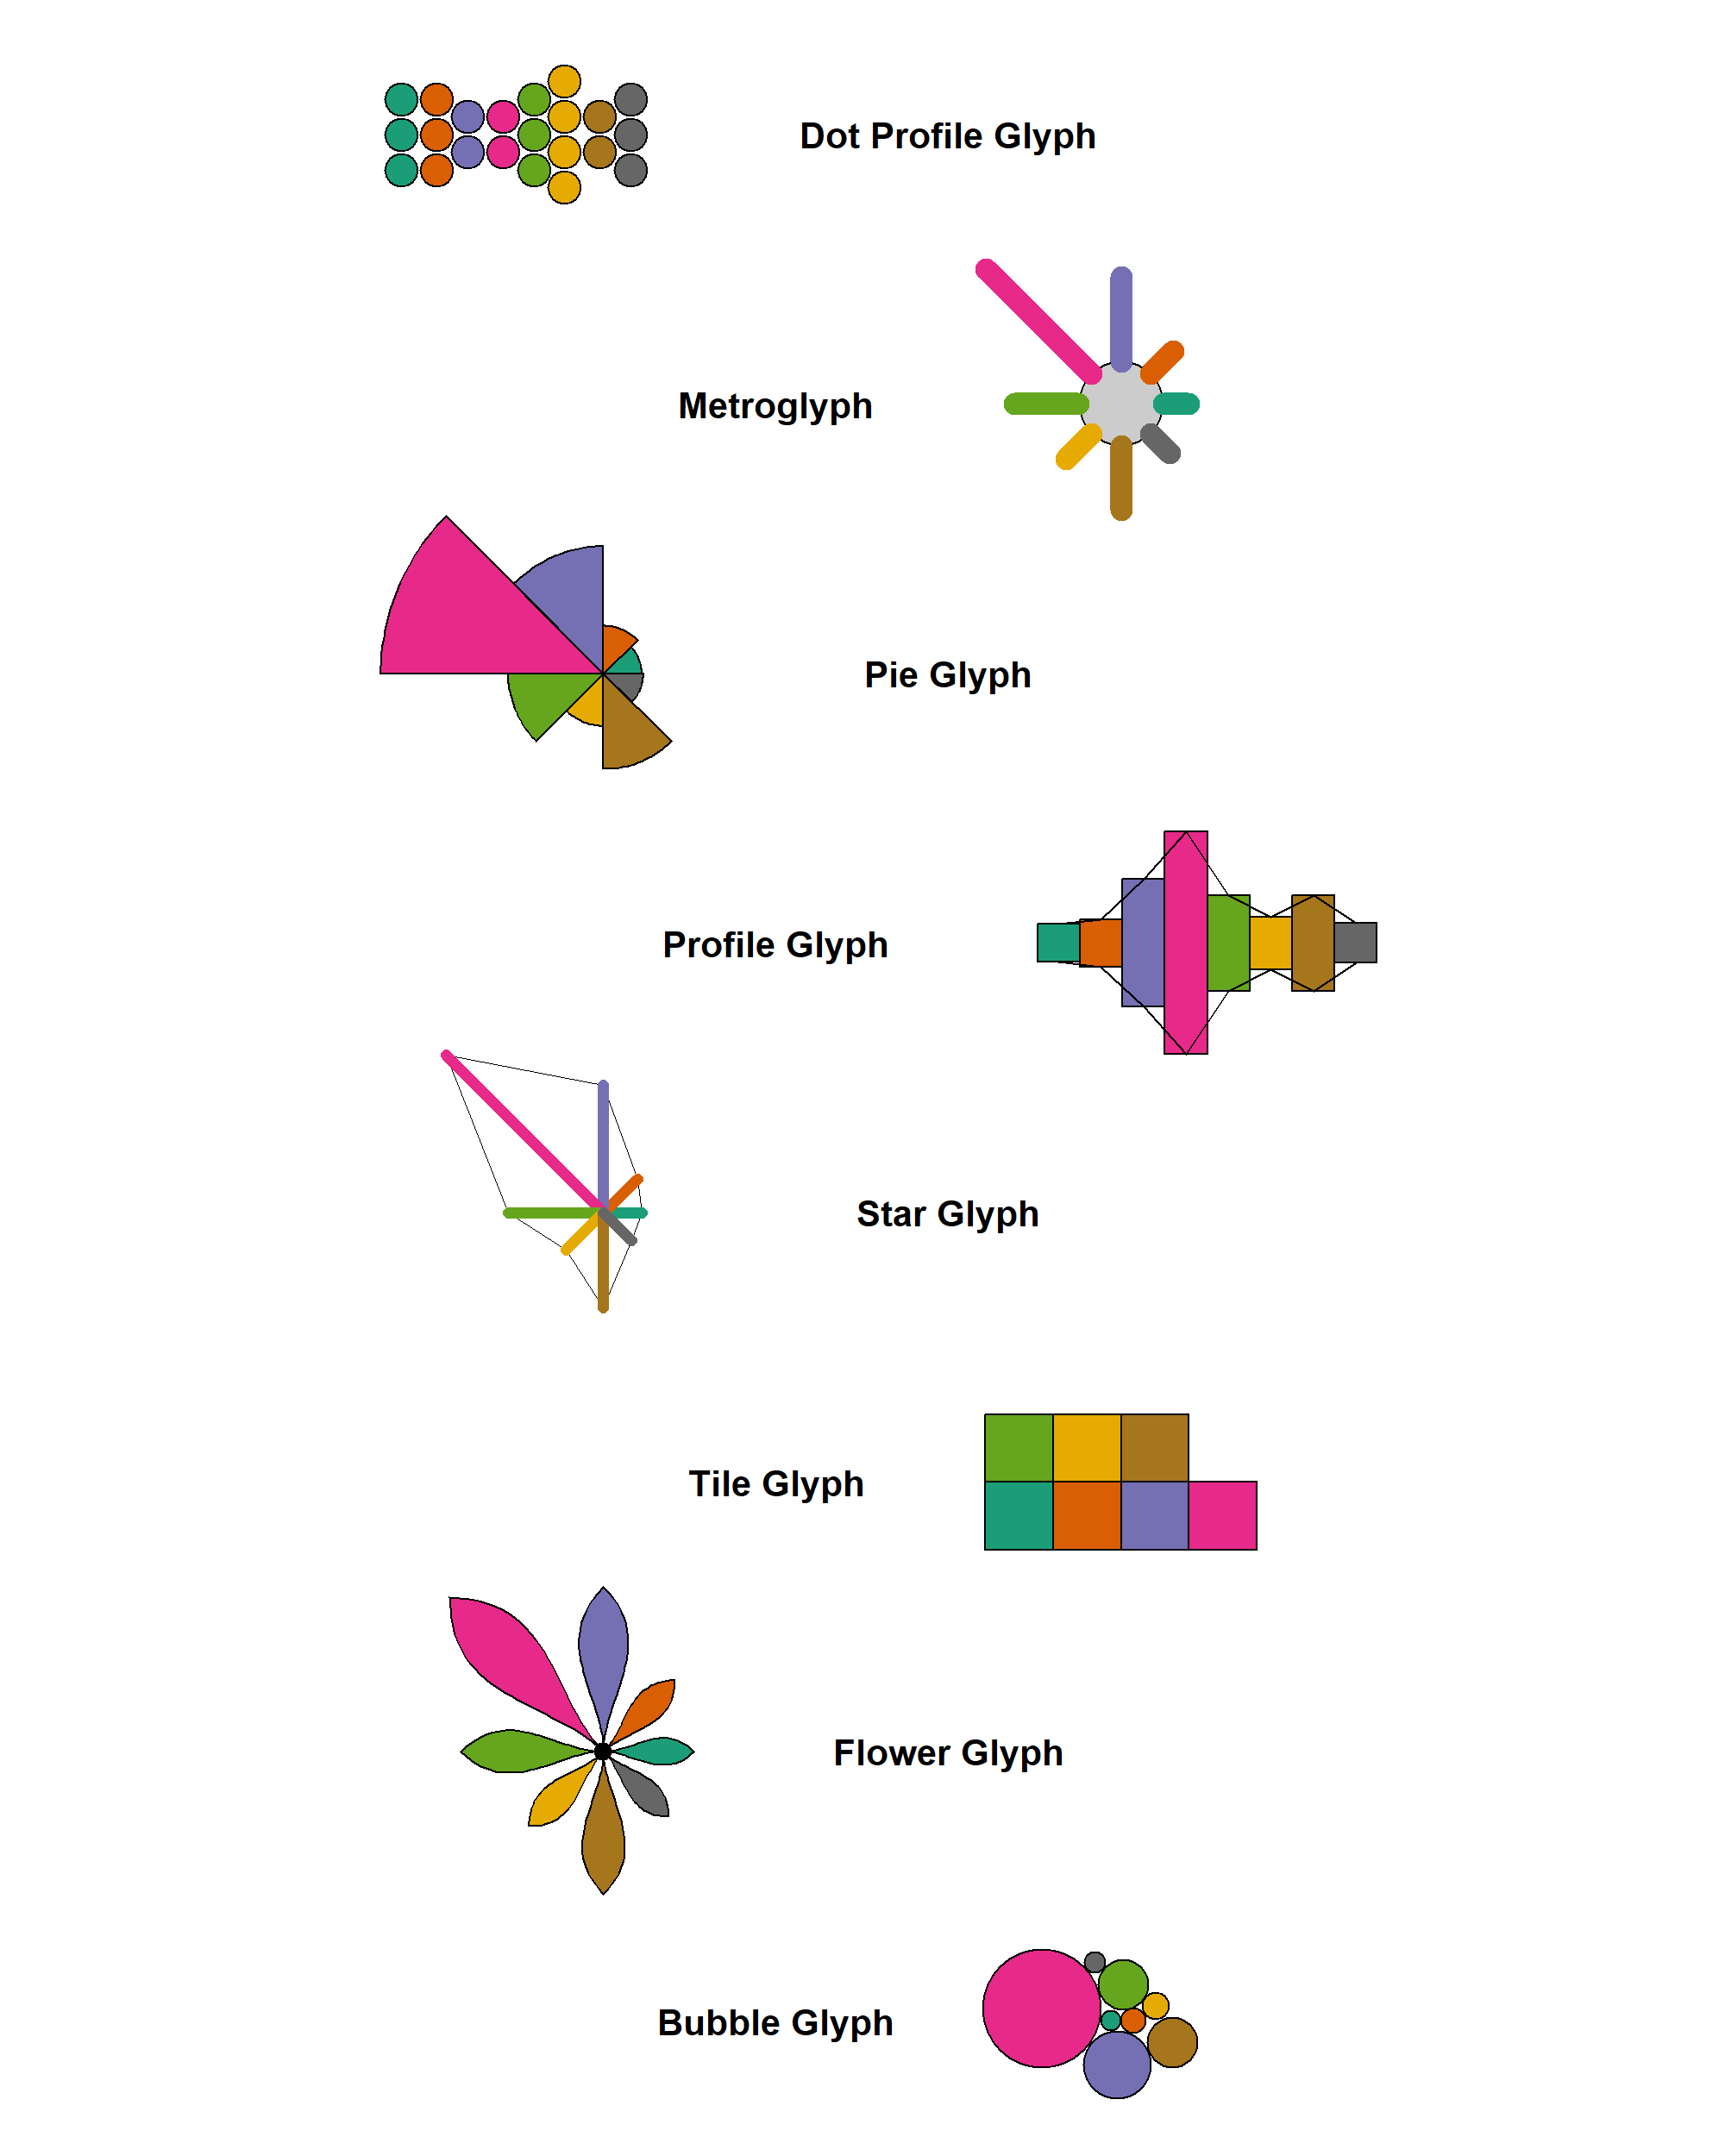
ggmultiglyph v0.1.0: Provides ggplot2 geoms for visualizing multivariate data using glyphs. The package implements several established glyph designs described in the information visualization literature, including the review by Borgo et al. (2013).
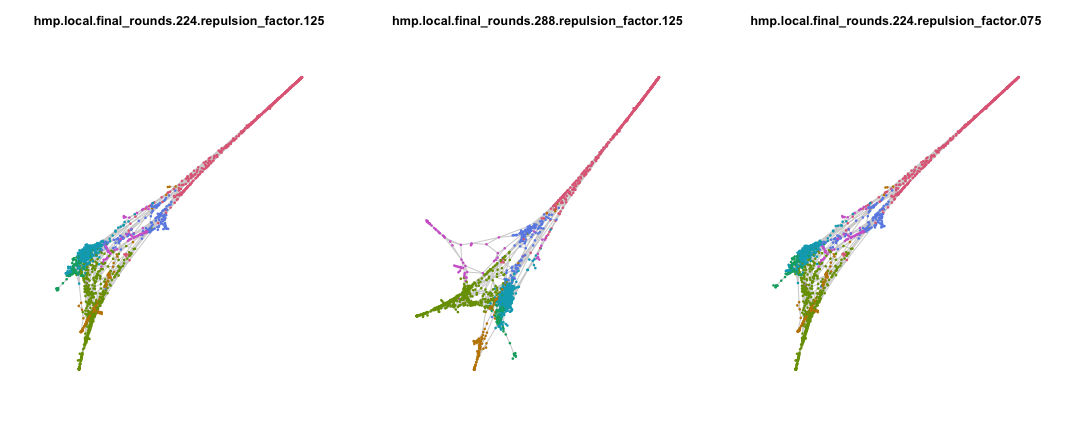
grip v0.2.0: Implements GRIP multiscale graph layout with a unified choice between hop-count and geometry-aware edge-length graph metrics in 2D and 3D. Provides layout scoring, candidate comparison, multiscale trace diagnostics, synthetic graph families, and advanced experimental geodesic-KK utilities for weighted-layout evaluation and polish. Based on Gajer and Kobourov (2002) and Gajer, Goodrich and Kobourov (2004). There are four vignettes including Getting Started and Weighted Graph Layouts.
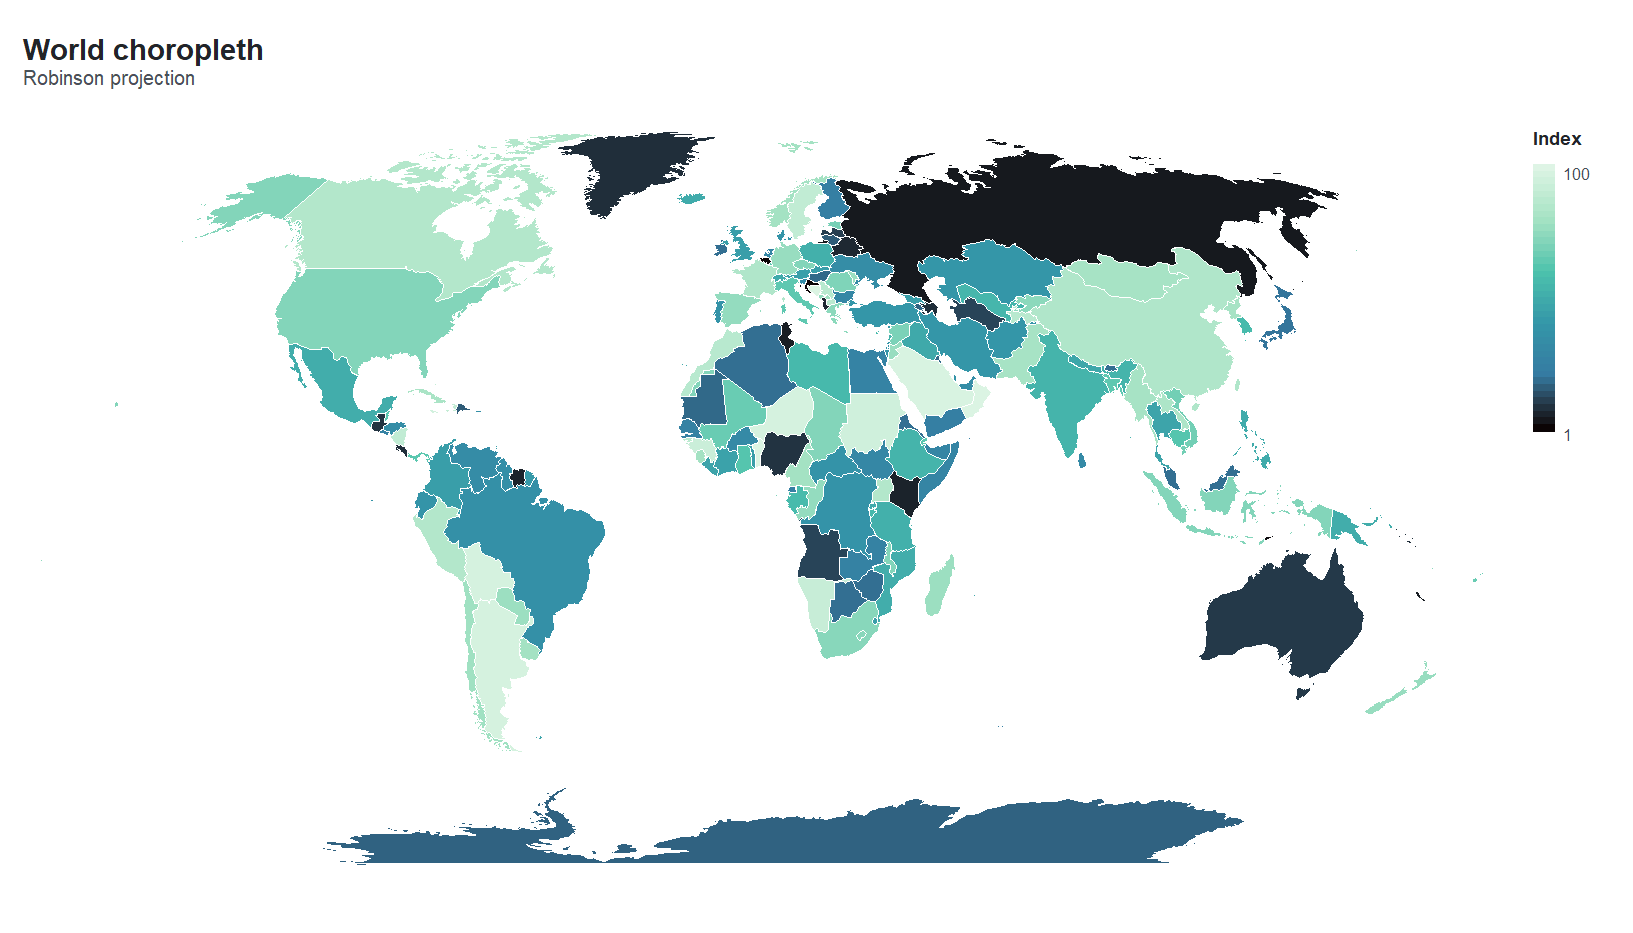
orbis v0.1.0: Implements a layered grammar of graphics that compiles plots to a resolution-independent scene description and renders it through two back-ends: a self-contained SVG writer with embedded JavaScript for interactive figures (tooltips, hover highlighting, zoom, pan and legend toggling) and R’s own graphics devices for publication-quality output at any resolution. Geographic layers are first class. The layered grammar follows Wickham (2010); projections follow Snyder (1987) and, for Equal Earth, Savric, Patterson and Jenny (2019); line simplification uses Douglas and Peucker (1973); the default colour scales follow the guidance on perceptually uniform palettes of Crameri, Shephard and Heron (2020). See the vignette