“Top 40” is back, broadcasting on the new R Works blog. I hope to continue the monthly evaluation of R packages that ran for several years on RStudio’s R Views Blog. The following is an idiosyncratic selection of the forty best new R packages submitted to CRAN in August 2024 organized into fourteen categories: Artificial Intelligence, Computational Methods, Data, Ecology, Environment, Genomics, Machine Learning, Medicine, Pharma, Science, Statistics, Time Series, Utilities, and Visualization.
Artificial Intelligence
gemini.R v0.5.2: Provides an R interface to Google Gemini API for advanced language processing, text generation, and other AI-driven capabilities within the R environment. See README to get started.
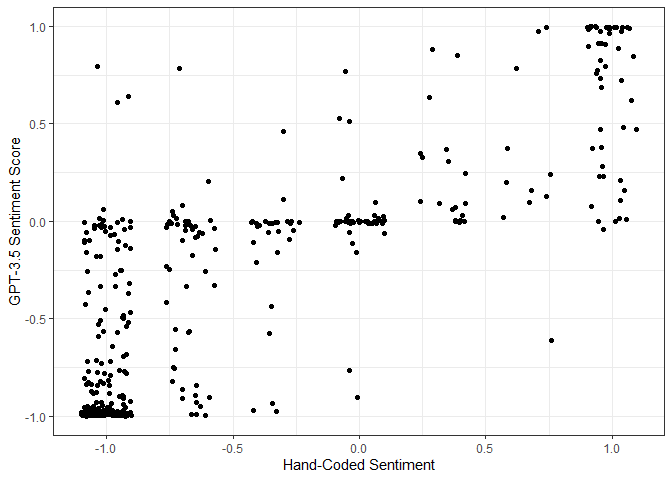
promptr v1.0.0: Provides functions to form and submit prompts to OpenAI’s Large Language Models. Designed to be particularly useful for text classification problems in the social sciences. See Ornstein, Blasingame, & Truscott (2024) for details and README for an example.
Computational Methods
qvirus v 0.0.2: Provides code and resources to explore the intersection of quantum computing and artificial intelligence (AI) in the context of analyzing Cluster of Differentiation 4 (CD4) lymphocytes and optimizing antiretroviral therapy (ART) for human immunodeficiency virus (HIV). See the vignettes Introduction, Applications, and Entanglement.
RcppBessel v1.0.0: Exports an Rcpp interface for the Bessel functions in the ‘Bessel’ package, which can then be called from the C++ code of other packages. For the original ‘Fortran’ implementation of these functions, see Amos (1995). There is a vignette.
Data
aebdata v0.1.0: Facilitates access to the data from the Atlas do Estado Brasileiro maintained by the Instituto de Pesquisa Econômica Aplicada (Ipea). It allows users to search for specific series, list series, or themes, and download data when available. See the vignette.
capesData v0.0.1: Provides information on activities to promote scholarships in Brazil and abroad for international mobility programs recorded in the CAPES database from 2010 to 2019. See README to get started.
Ecology
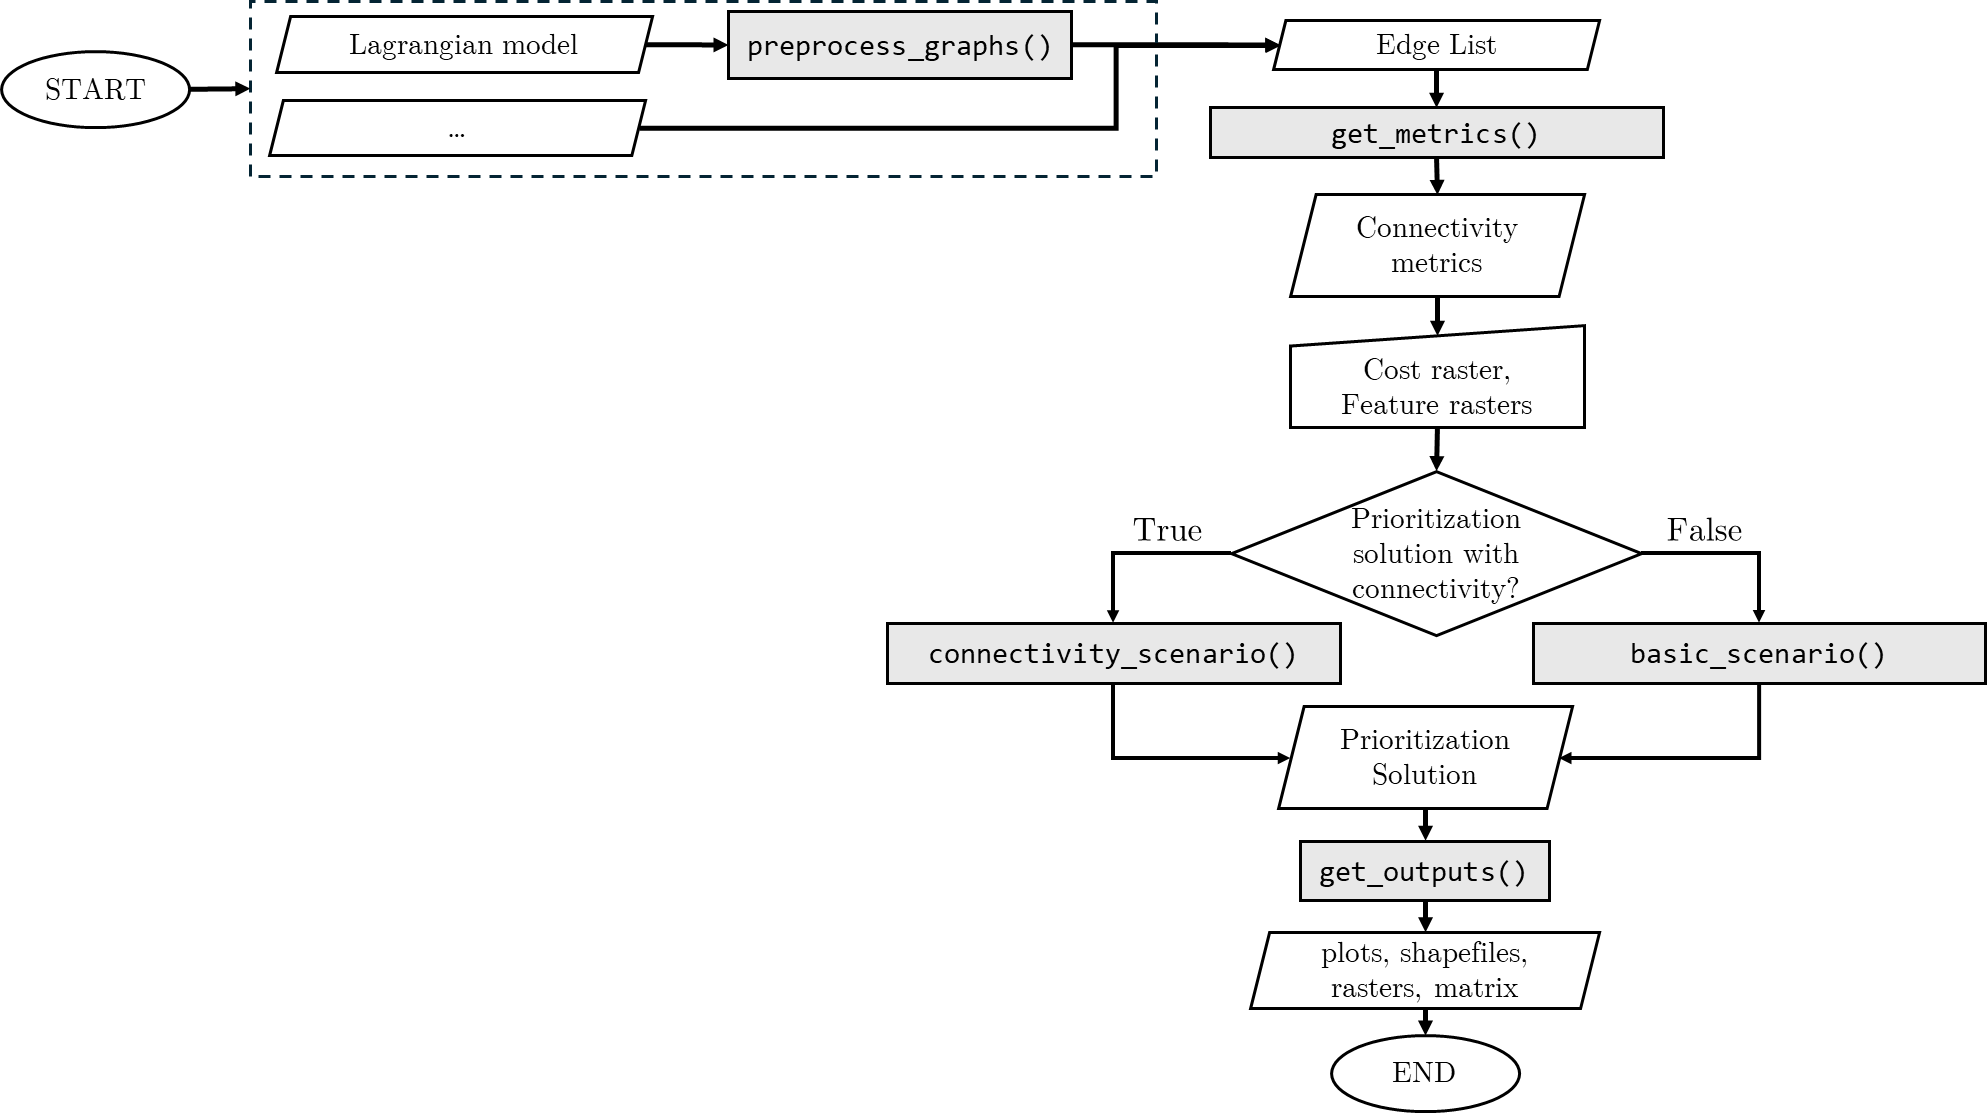
priorCON v0.1.1: Provides a tool set that incorporates graph community detection methods into systematic conservation planning. It is designed to enhance spatial prioritization by focusing on the protection of areas with high ecological connectivity and on clusters of features that exhibit strong ecological linkages. See the Introduction.
Environment
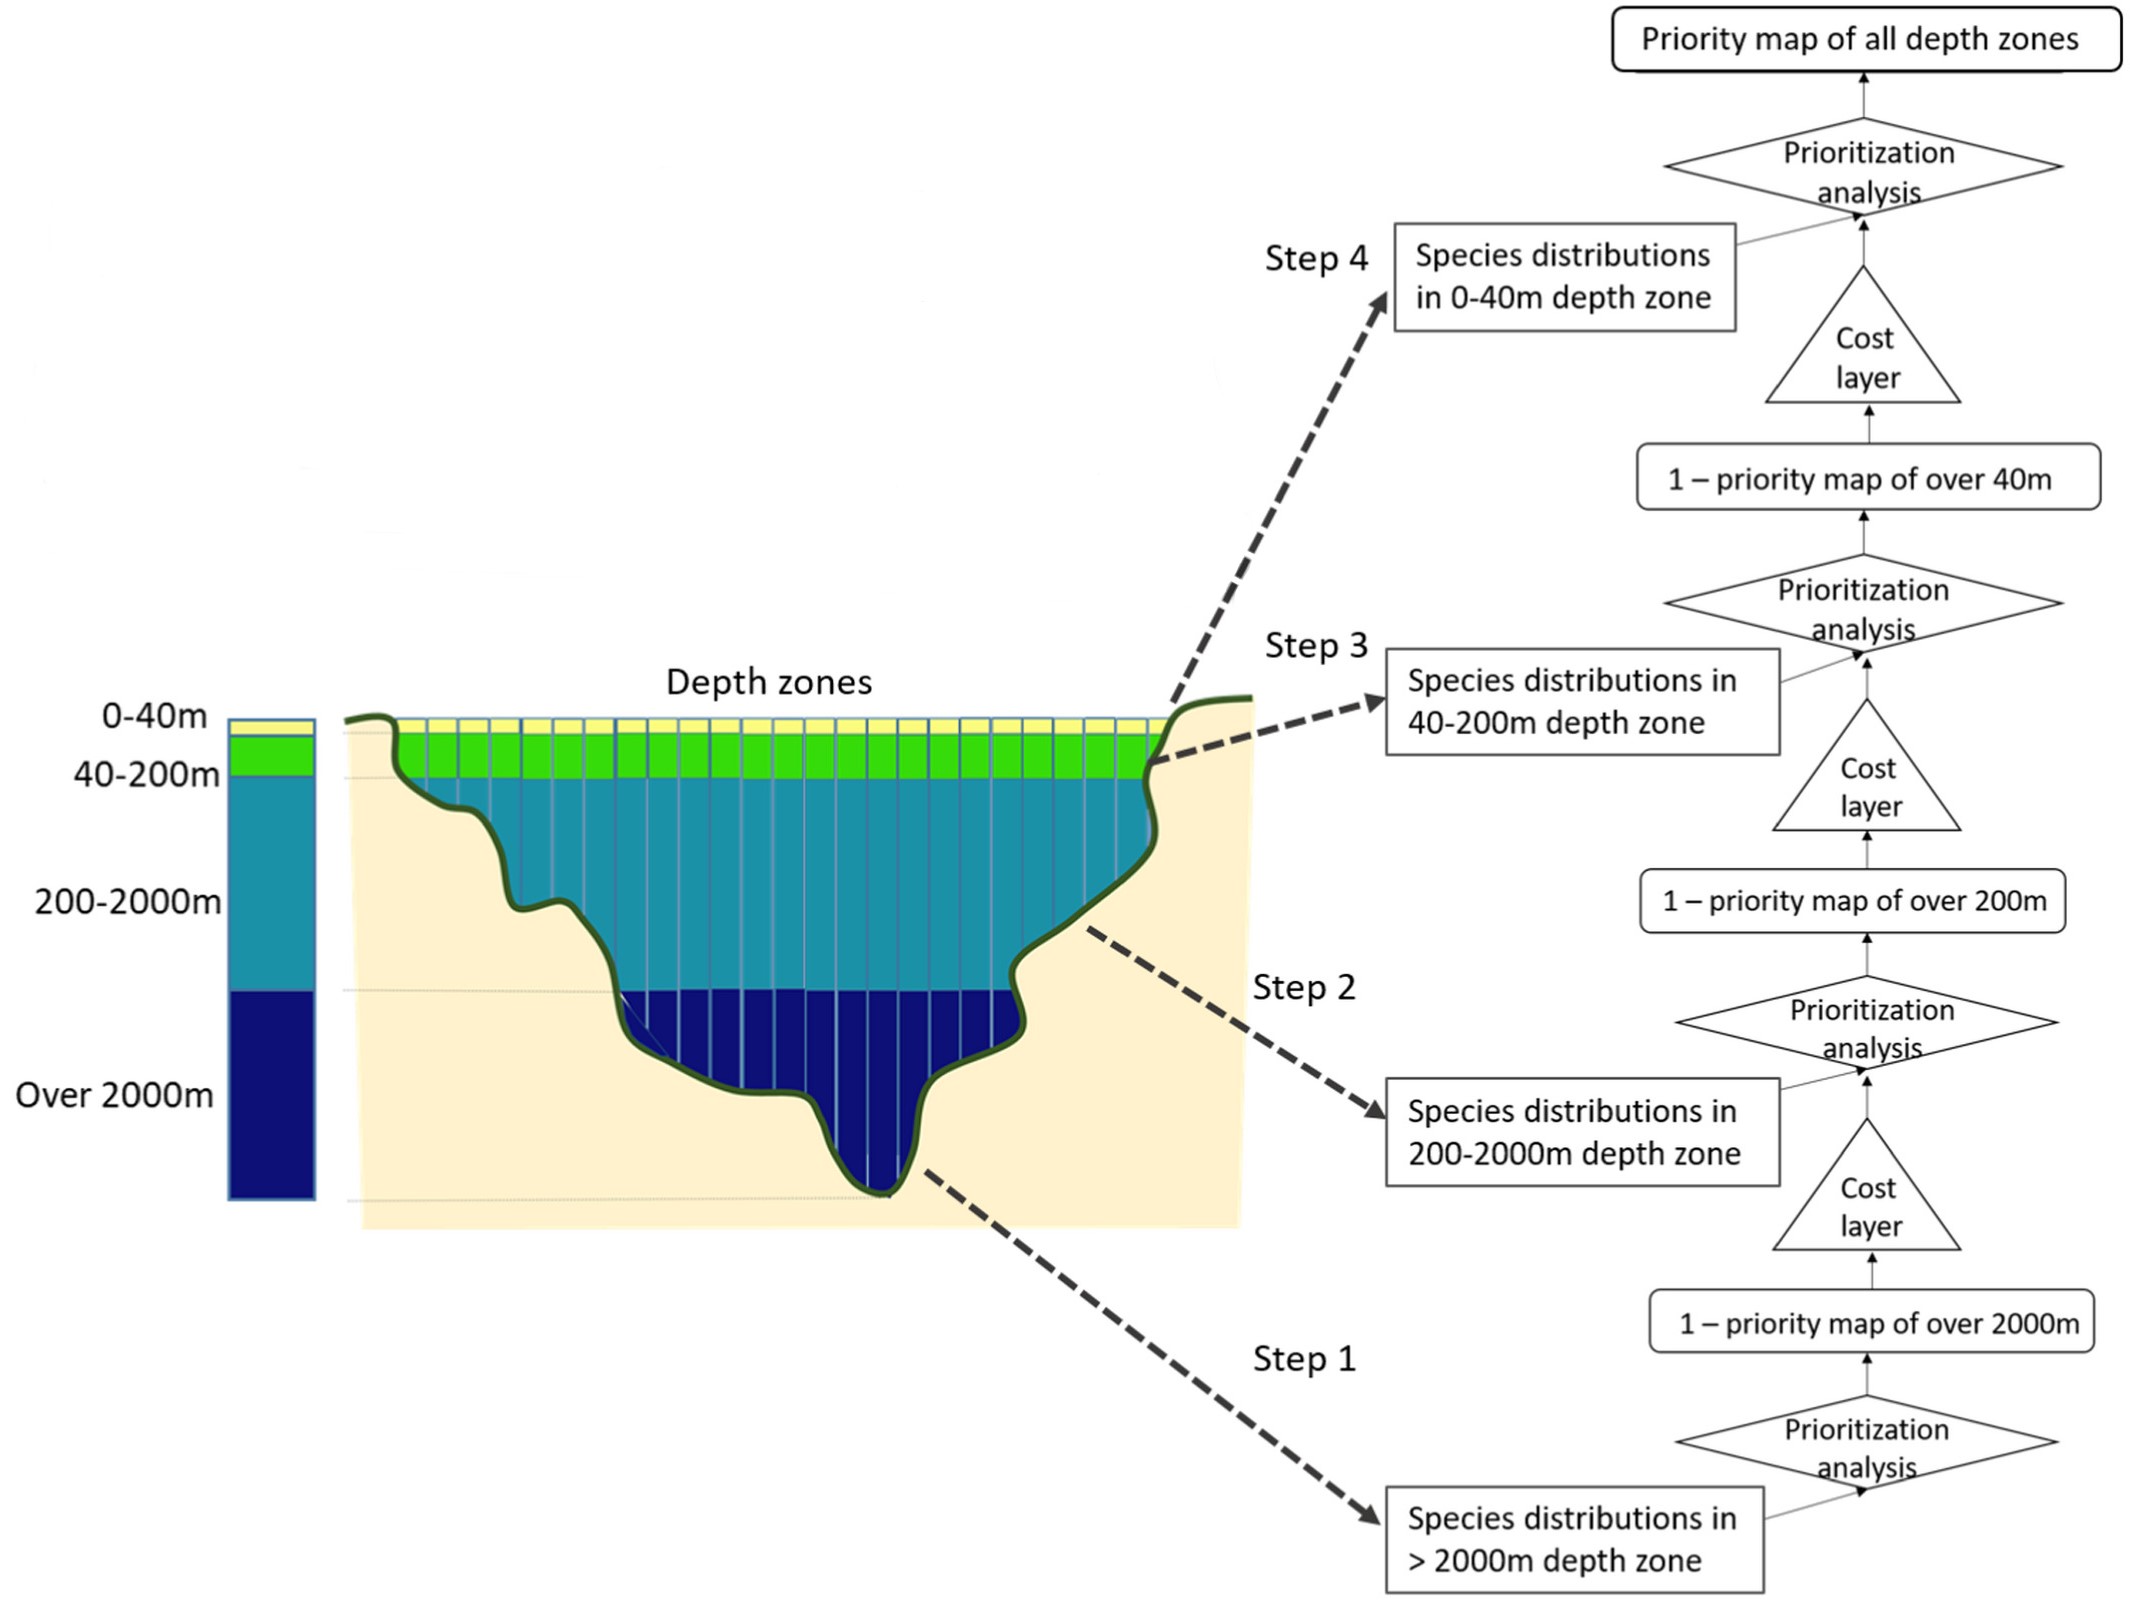
prior3D v0.1.0: Offers a comprehensive toolset for 3D systematic conservation planning, conducting nested prioritization analyses across multiple depth levels and ensuring efficient resource allocation throughout the water column. See Doxa et al. (2022) for background and the vignette for an example.
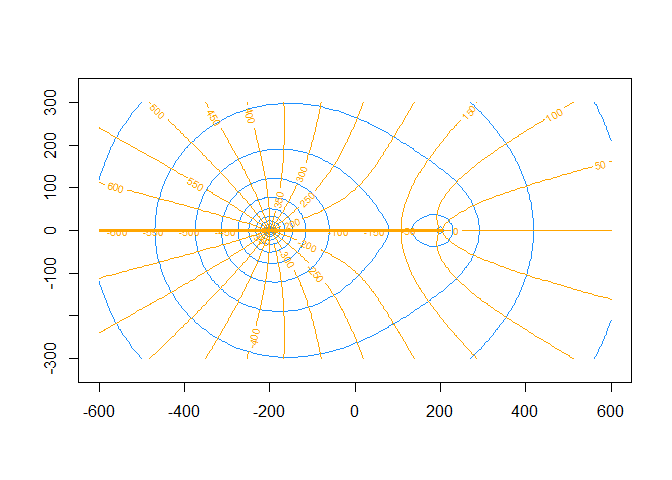
raem v0.1.0: Implements a model of single-layer groundwater flow in steady-state under the Dupuit-Forchheimer assumption can be created by placing elements such as wells, area-sinks, and line-sinks at arbitrary locations in the flow field. See Haitjema (1995) for the underlying theory and the vignettes Overview and Exporting spatial data.
Genomics
kmeRtone v 1.0: Provides functions for multi-purpose k-meric enrichment analysis, which measures the enrichment of k-mers by comparing the population of k-mers in the case loci with an internal negative control group consisting of k-mers from regions close to, yet sufficiently distant from, the case loci. This method captures both the local sequencing variations and broader sequence influences while also correcting for potential biases. See the GitHub repo for an overview.
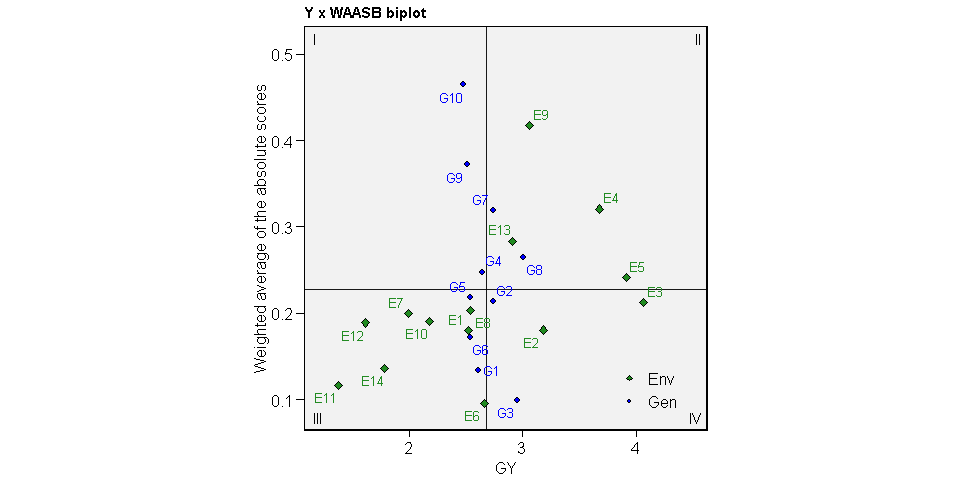
rYWAASB v0.1: Provides a new ranking algorithm to distinguish the top-ranked genotypes. “WAASB” refers to the “Weighted Average of Absolute Scores” provided by Olivoto et al. (2019), which quantifies the stability of genotypes across different environments using linear mixed-effect models. See the vignette for an example.
Machine Learning
cvLM v1.0.4: Provides efficient implementations of cross-validation techniques for linear and ridge regression models, leveraging C++ code with Rcpp that supports leave-one-out, generalized, and K-fold cross-validation methods. See README for an example.
geodl v0.2.0: Provides tools for semantic segmentation of geospatial data using convolutional neural network-based deep learning, including utility functions for manipulating data, model checks, functions to implement a UNet architecture with four blocks in the encoder, assessment metrics, and more. The package relies on torch but does not require installing a Python environment. Models can be trained using a Compute Unified Device Architecture (CUDA)-enabled graphics processing unit (GPU). There are ten vignettes, including spatialPredictionDemo and topoDLDemo.
idiolect v1.0.1: Provides functions for the comparative authorship analysis of disputed and undisputed texts within the Likelihood Ratio Framework for expressing evidence in forensic science and implements well-known algorithms, including Smith and Aldridge’s (2011) Cosine Delta and Koppel and Winter’s (2014) Impostors Method. See the vignette.
kdml v1.0.0: Implements distance metrics for mixed-type data consisting of continuous, nominal, and ordinal variables, which can be used in any distance-based algorithm, such as distance-based clustering. See Ghashti and Thompson (2024) for dkps() methodology, Ghashti (2024) for dkss() methodology, and the vignette.
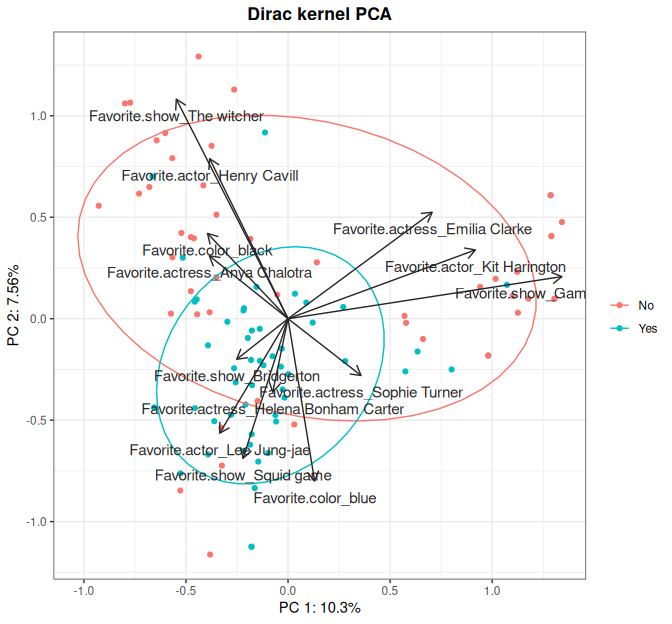
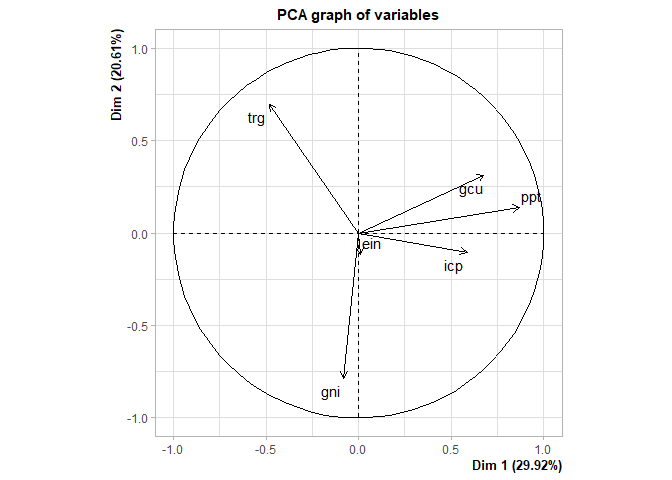
kerntools v1.0.2: Provides kernel functions for diverse types of data including, but not restricted to: non-negative and real vectors, real matrices, categorical and ordinal variables, sets, strings, plus other utilities like kernel similarity, kernel Principal Components Analysis (PCA) and features’ importance for Support Vector Machines (SVMs). See the vignette.
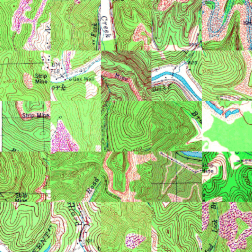
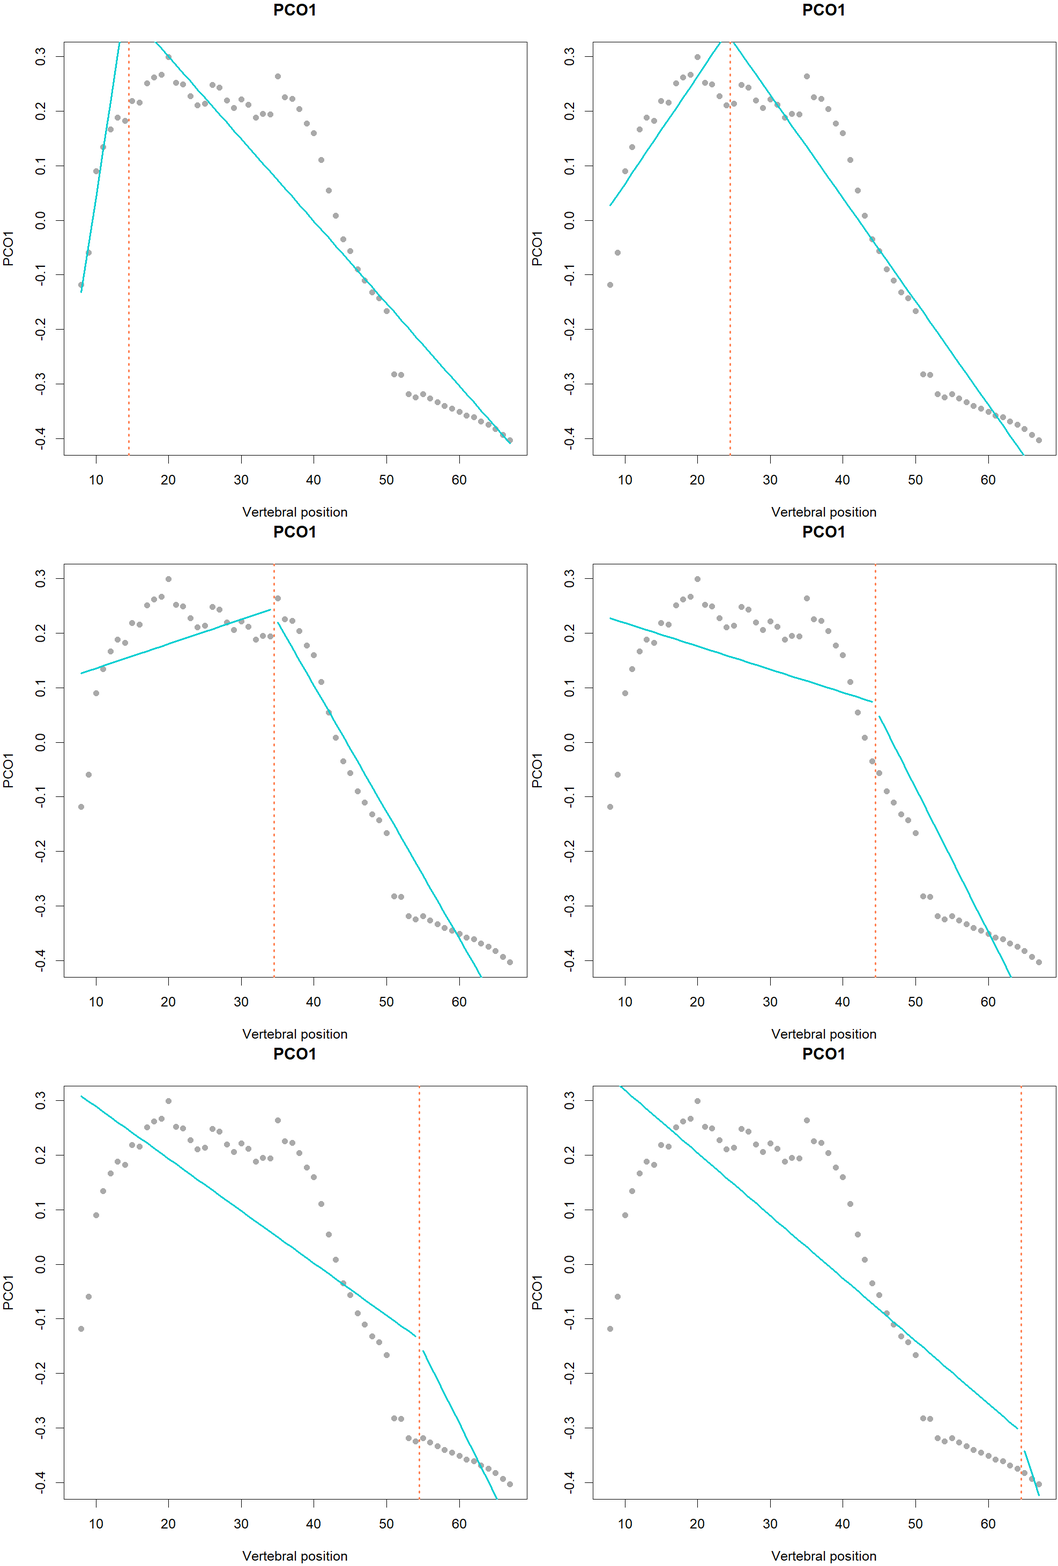
MorphoRegions v0.1.0: Provides functions to computationally identify regions in serially homologous structures such as, but not limited to, the vertebrate backbone. Regions are modeled as segmented linear regressions, with each segment corresponding to a region and region boundaries (or breakpoints) corresponding to changes along the serially homologous structure.
Medicine
neuroUP v0.3.1: Provides functions to calculate the precision in mean differences (raw or Cohen’s D) and correlation coefficients for different sample sizes using permutations of the collected functional magnetic resonance imaging (fMRI) data. See Klapwijk et al. (2024) for background and the vignette for an introduction.
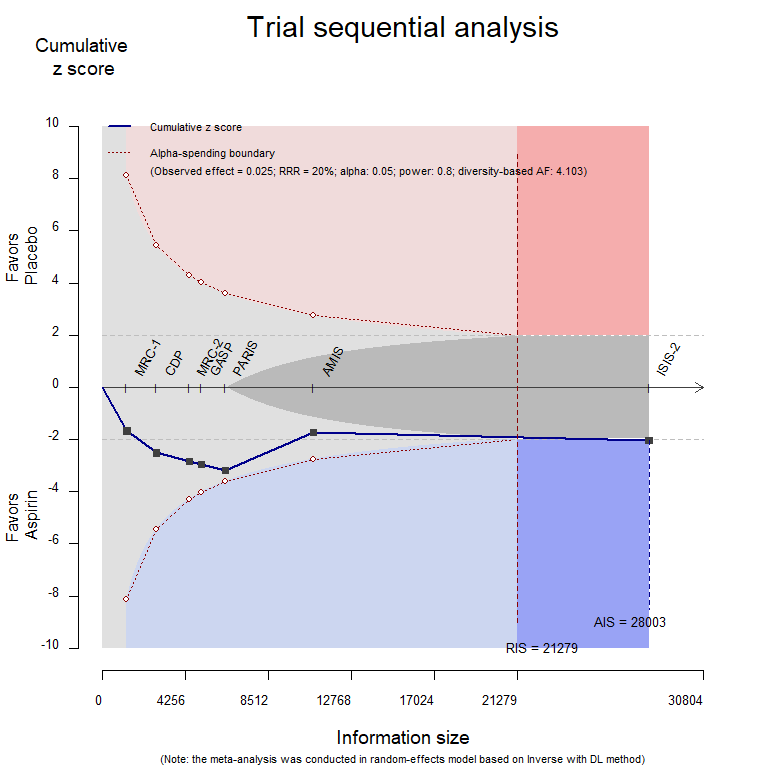
smiles v0.1-0: Provides tools aimed at making data synthesis and evidence evaluation easier for both experienced practitioners and newcomers. See the Cochrane Handbook for Systematic Reviews of Interventions and the vignette for examples.
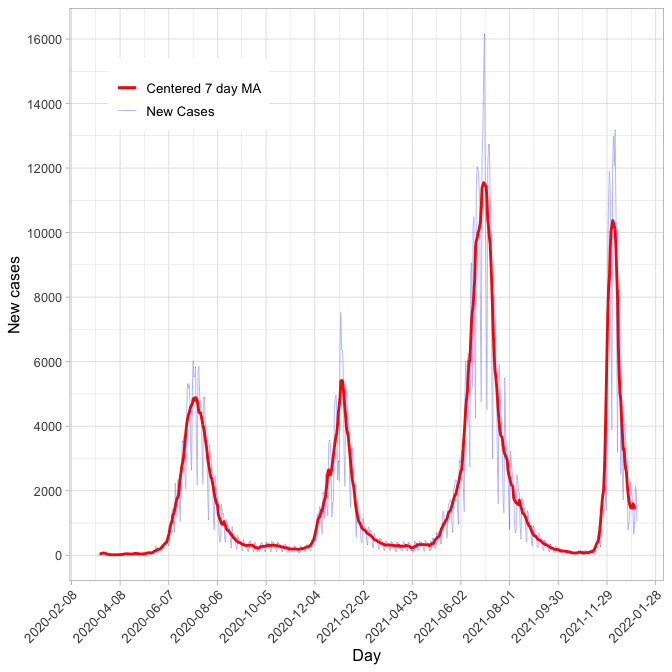
tsgc v0.0: Provides tools to analyze and forecast epidemic trajectories based on a dynamic Gompertz model and a state space approach that uses the Kalman filter for robust estimation of the non-linear growth pattern commonly observed in epidemic data. See Harvey and Kattuman (2020), Harvey and Kattuman (2021), and Ashby et al. (2024) for background and the vignette for details.
Pharma
admiralpeds v0.1.0: Provides a toolbox for programming Clinical Data Standards Interchange Consortium (CDISC) compliant Analysis Data Model (ADaM) data sets in R. See the vignette for an example.
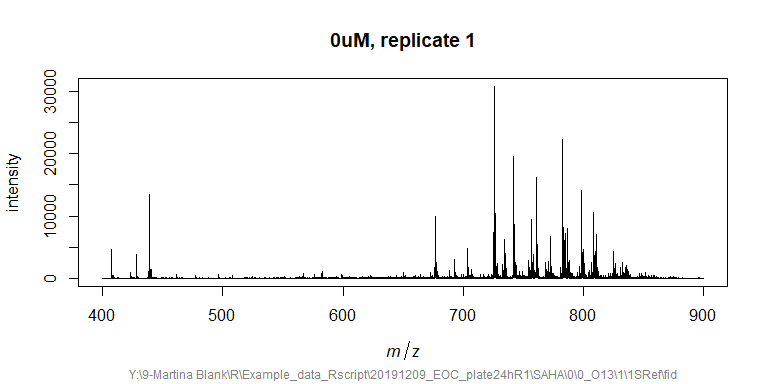
MALDIcellassay v0.4.47: Implements tools to conduct automated cell-based assays using Matrix-Assisted Laser Desorption/Ionization (MALDI) methods for high-throughput screening of signals responsive to treatments. The methodologies were introduced by Weigt et al. (2018) and Unger et al. (2021). See the vignette for an example.
Science
barrks v1.0.0: Implements models to calculate the bark beetle phenology and their submodels, onset of infestation, beetle development, diapause initiation, and mortality, which can be customized and combined. Models include PHENIPS-Clim, PHENIPS, RITY, CHAPY, and BSO. There are five vignettes, including The BSO model and Example: Model Comparison.
fluxible v0.0.1: Provides functions to process the raw data from closed loop flux chamber (or tent) setups into ecosystem gas fluxes usable for analysis. Implemented models include exponential Zhao et al. (2018) and quadratic and linear models to estimate the fluxes from the raw data. See the vignette for an example.
Statistics
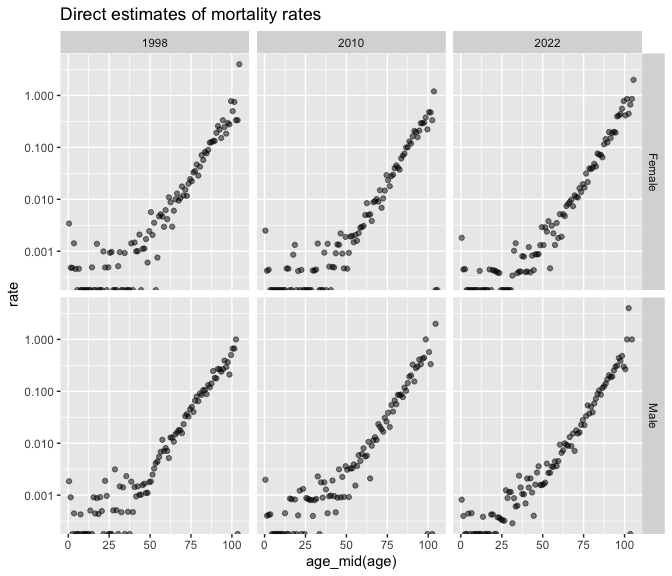
bage v0.7.4: Provides functions for Bayesian estimation and forecasting of age-specific rates, probabilities, and means based on the Template Model Builder. There are six vignettes, including the Mathematical Details and an Example.
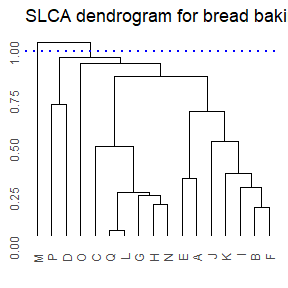
clustMC v0.1.1: Implements cluster-based multiple comparisons tests and also provides a visual representation in the form of a dendrogram. See Rienzo, Guzmán & Casanoves (2002) and Bautista, Smith & Steiner (1997), and the vignette for examples.
svycdiff v0.1.1: Provides three methods for estimating the population average controlled difference for a given outcome between levels of a binary treatment, exposure, or other group membership variables of interest for clustered, stratified survey samples where sample selection depends on the comparison group. See Salerno et al. (2024) for background and the vignette for an example.
wishmom v1.1.0: Provides functions for computing moments and coefficients related to the Beta-Wishart and Inverse Beta-Wishart distributions, including functions for calculating the expectation of matrix-valued functions of the Beta-Wishart distribution, coefficient matrices, and expectation of matrix-valued functions of the inverse Beta-Wishart distribution. See the vignette for details.
Time Series
tican v1.0.1: Provides functions to analyze and plot time-intensity curves such as those that arise from contrast-enhanced ultrasound images. See the vignette.
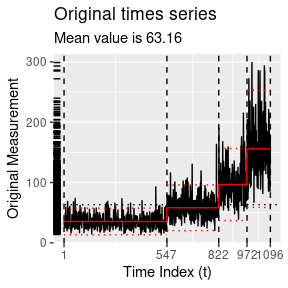
tidychangepoint v0.0.1: Provides a tidy, unified interface for several different changepoint detection algorithms, along with a consistent numerical and graphical reporting leveraging the broom and ggplot2 packages. See the vignette.
Utilities
fio v0.1.2: Provides tools to simplify the process of importing and managing input-output matrices from Microsoft Excel into R. It leverages the R6 class for memory-efficient object-oriented programming implements all linear algebra computations in Rust. See the vignette.
litedown v0.2: Implements a lightweight version of R Markdown, which enables rendering R Markdown to Markdown without using knitr, and Markdown to lightweight HTML/LaTeX documents using the commonmark package instead of Pandoc. This package can be viewed as a trimmed-down version of R Markdown and knitr, which does not aim at rich Markdown features or a large variety of output formats. There are vignettes on Markdown Examples, HTML Output Examples, and Making HTMLSlides.
maestro v0.2.0: Implements a framework for creating and orchestrating data pipelines allowing users to organize, orchestrate, and monitor multiple pipelines in a single project. There are four vignettes, including a Quick Start Guide and Use Cases.
osum v0.1.0: Inspired by S-PLUS function objects.summary(), provides a function that returns data class, storage mode, mode, type, dimension, and size information for R objects in the specified environment. Various filtering and sorting options are also proposed. See the vignette.
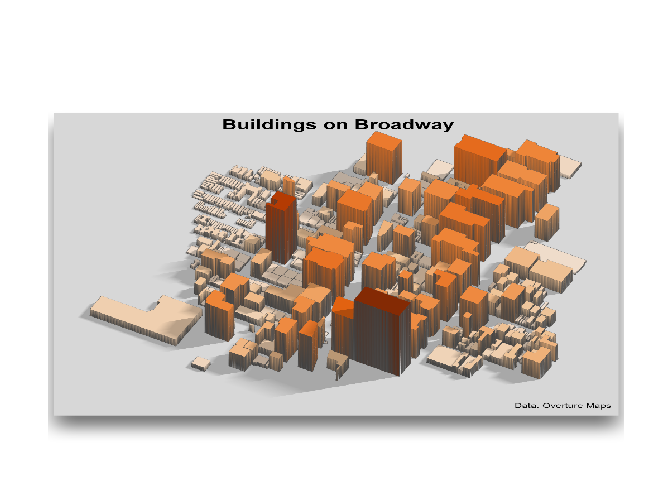
overtureR v0.2.3: Implements n integrated R interface to the Overture’ API which allows R users to return Overture data as dbplyr data frames or materialized sf spatial data frames. See README for examples.
RcppMagicEnum v0.0.1: Provides Rcpp bindings to header-only modern C++ template library Magic Enum. See README to get started.
tidymodelr v1.0.0: Provides a function to transform long data into a matrix form to allow for ease of input into modeling packages for regression, principal components, imputation, or machine learning along with level analysis wrapper functions for correlation and principal components analysis. See README for examples.
Visualization
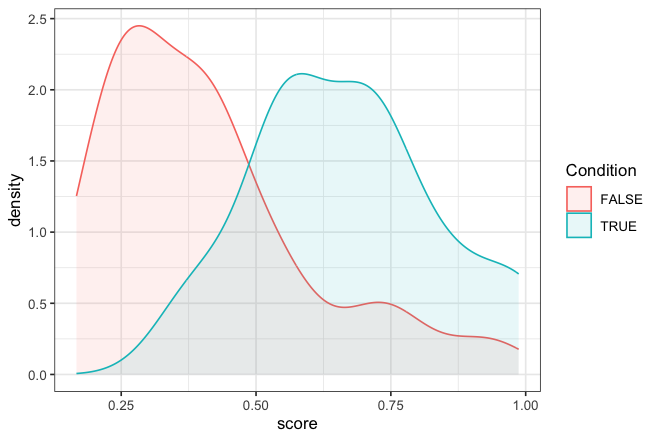
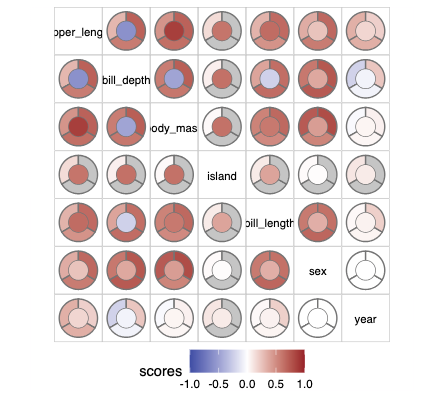
bullseye v0.1.0: Provides a tidy data structure and visualizations for multiple or grouped variable correlations, general association measures, diagnostics, and other pairwise scores suitable for numerical, ordinal, and nominal variables. Supported measures include distance correlation, maximal information, ace correlation, Kendall’s tau, and polychoric correlation. There are three vignettes including Calculating Pairwise Scores and Visualizing Pairwise Scores.
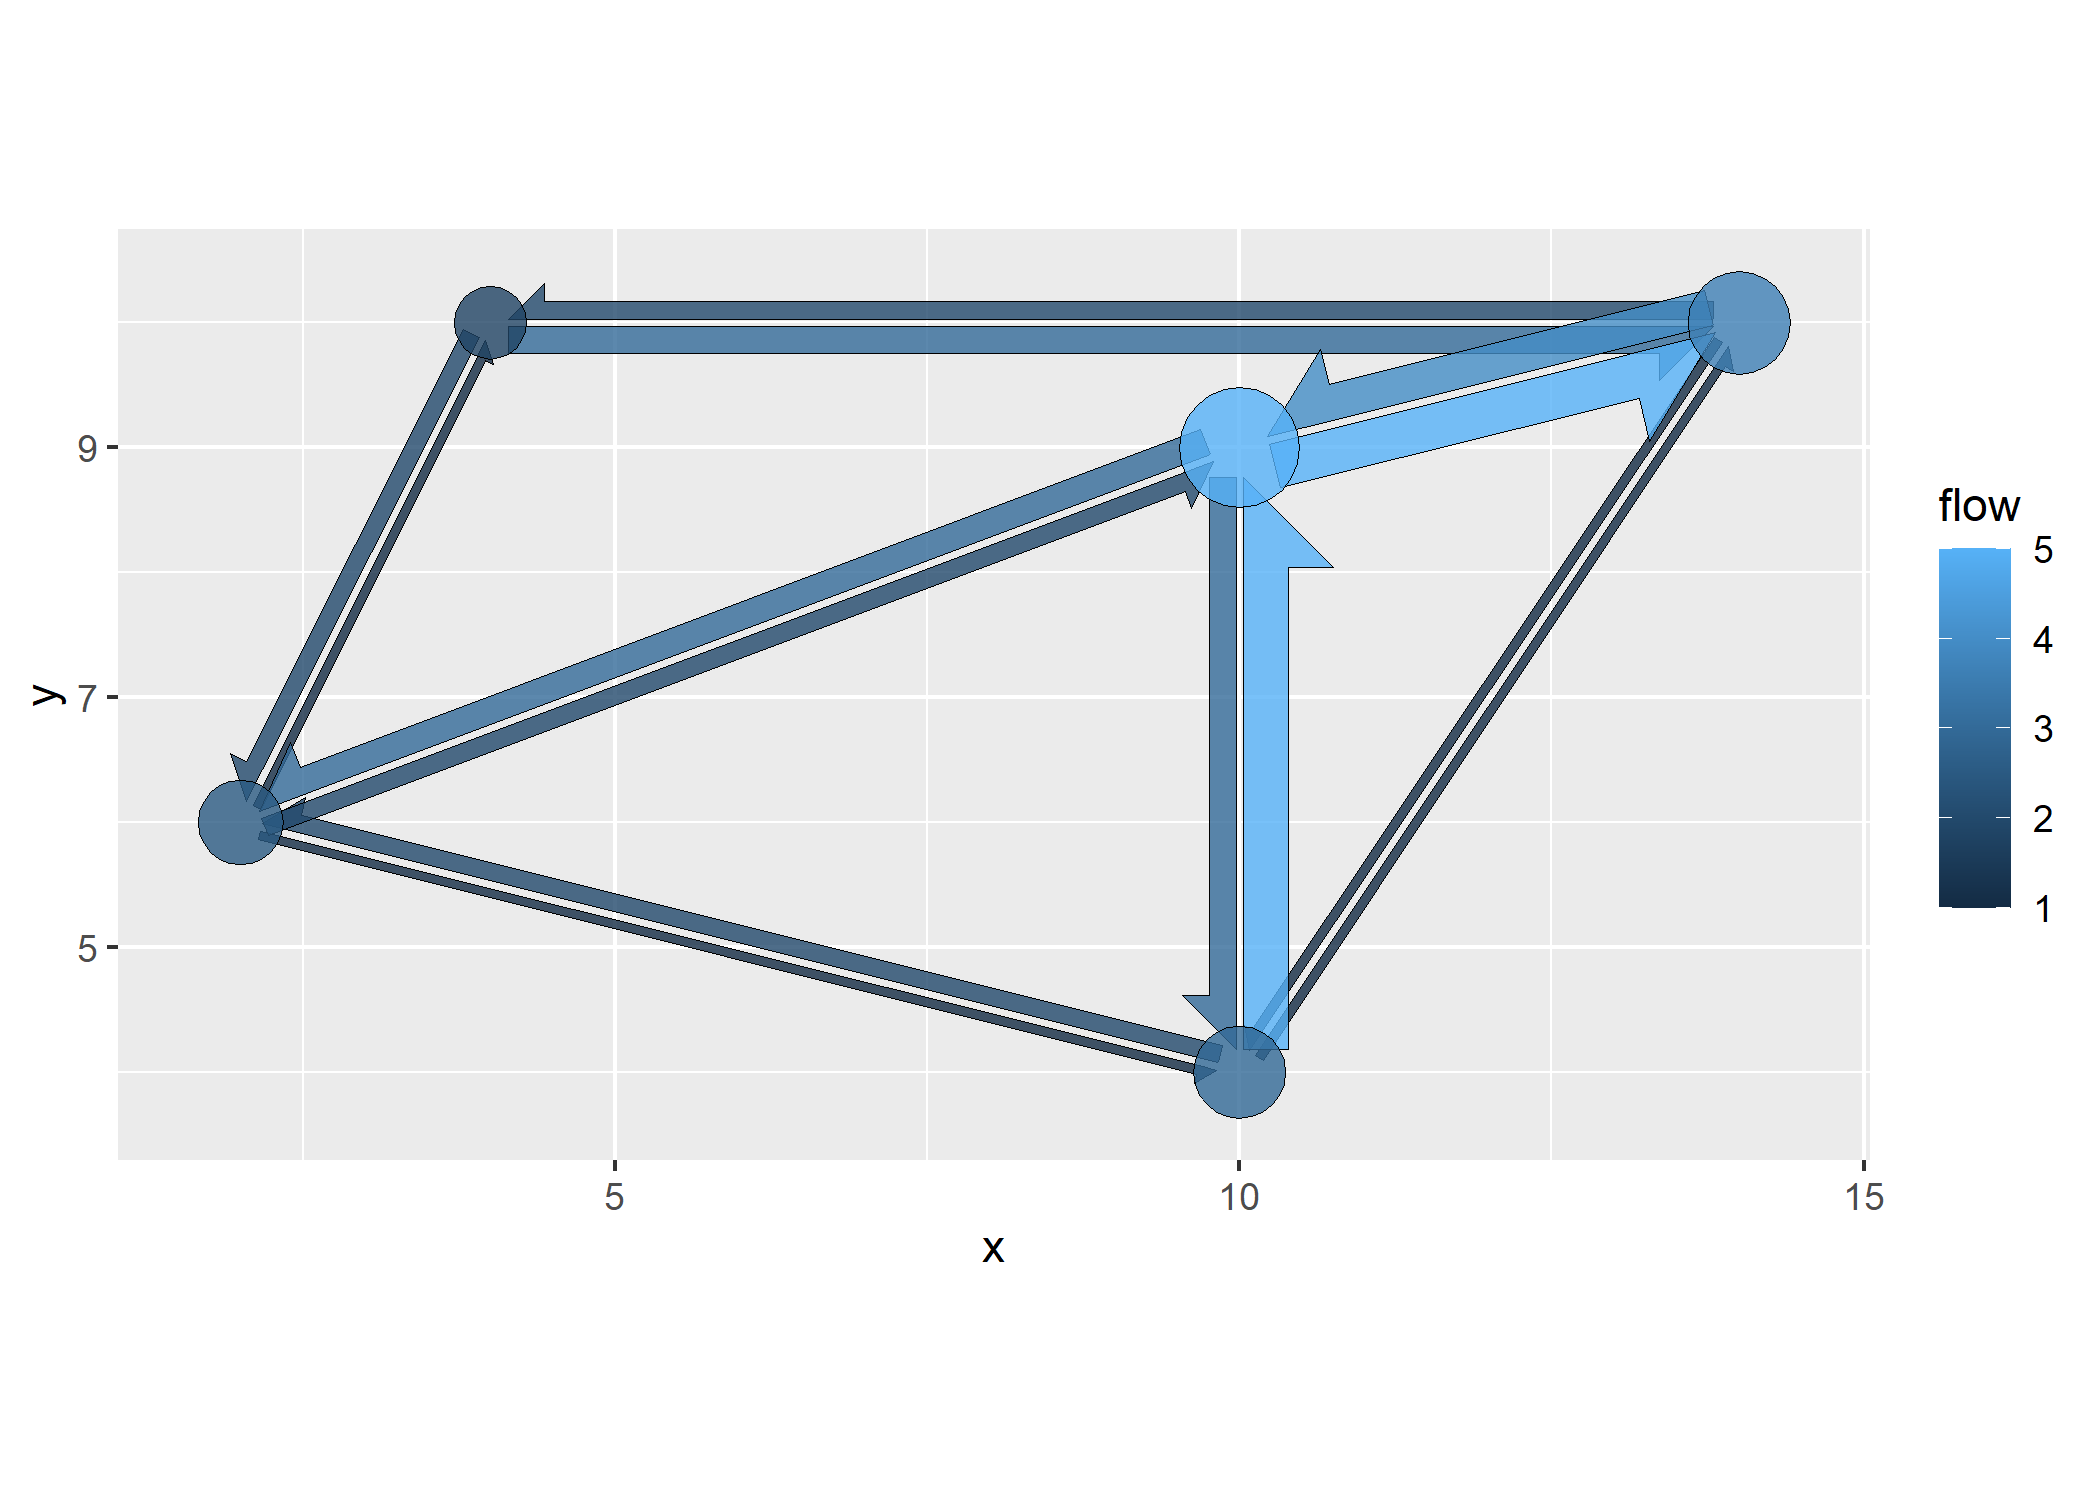
flowmapper v0.1.2: Adds flow maps to ggplot2 plots. These are layers that visualize the nodes as circles and the bilateral flows between the nodes as bidirectional half-arrows. Look here for details and examples.
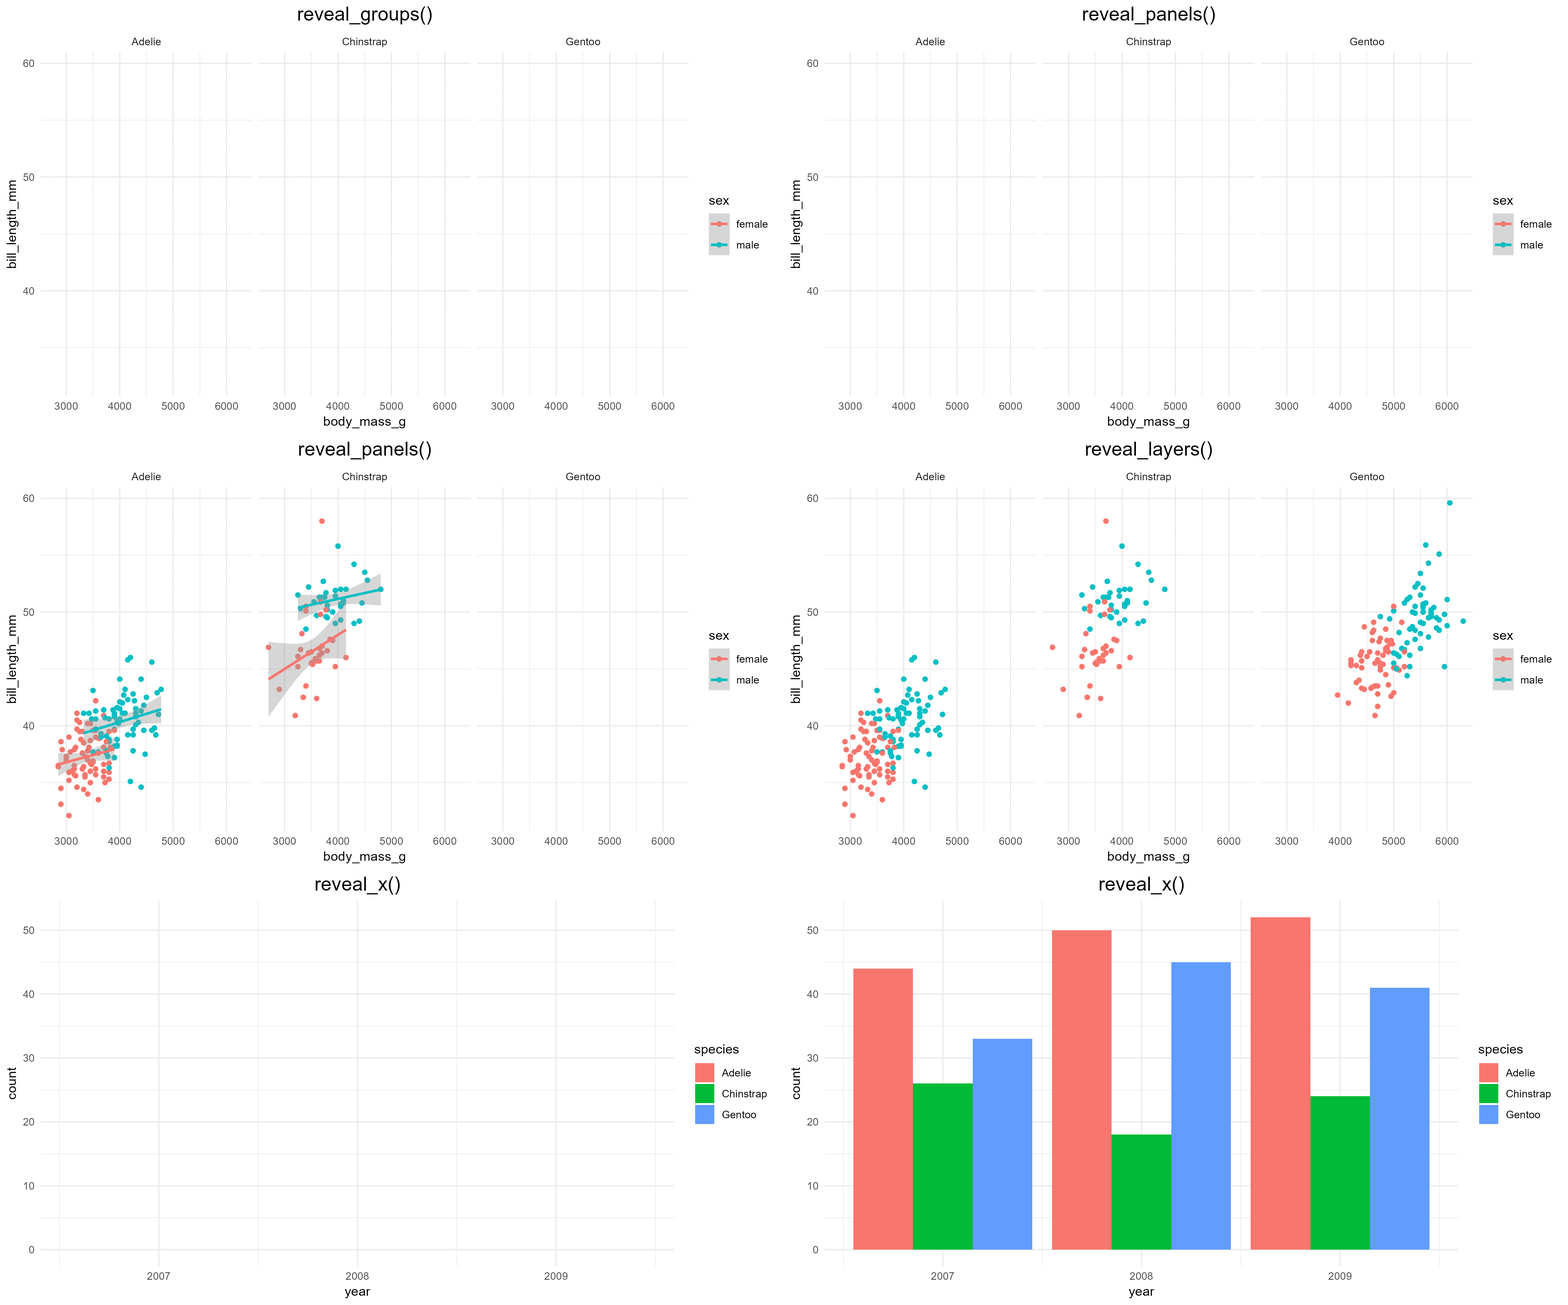
ggreveal v0.1.3: Provides functions that make it easy to reveal ggplot2 graphs incrementally. The functions take a plot produced with ggplot2 and return a list of plots showing data incrementally by panels, layers, groups, the values in an axis, or any arbitrary aesthetic. See the GitHub repo for examples.
