Two hundred and fifty-five of the new packages submitted to CRAN in February were still there in mid-March. Here are my Top 40 picks in seventeen categories: Artificial Intelligence, Biology, Buddhism, Climate Science, Computational Methods, Data, Ecology, Epidemiology, Genomics, Machine Learning, Medical Applications, Physics, Statistics, Surveys, Time Series, Utilities, and Visualization.
Artificial Intelligence
quallmer v0.3.0: Provides tools for AI-assisted qualitative data coding using large language models (‘LLMs’) via the ellmer package, supporting providers including OpenAI, Anthropic, Google, Azure, and local models via Ollama including built-in codebooks for common applications such as sentiment analysis and policy coding. Functions enable creating custom notebooks, support systematic replication across models and settings, compute inter-coder reliability statistics and validation metrics, and provide audit trails for documenting coding workflows following Lincoln and Guba’s (1985) framework for establishing trustworthiness in qualitative research. See the vignette to get started.
Biology
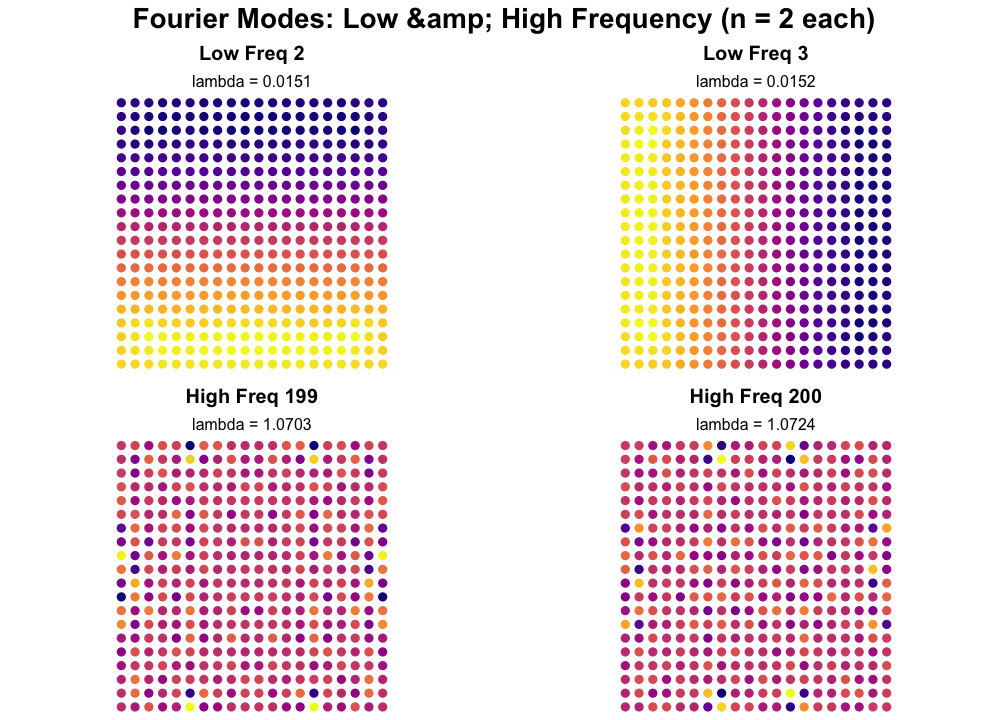
BioGSP v1.0.0: Implementation of Graph Signal Processing methods including Spectral Graph Wavelet Transform for analyzing spatial patterns in biological data and provides tools for multi-scale analysis of biology spatial signals, including forward and inverse transforms, energy analysis, and visualization functions tailored for biological applications. See Hammond, Vandergheynst, and Gribonval (2011) and Yao et al. (2024) for biological application examples, and the vignette to get started.
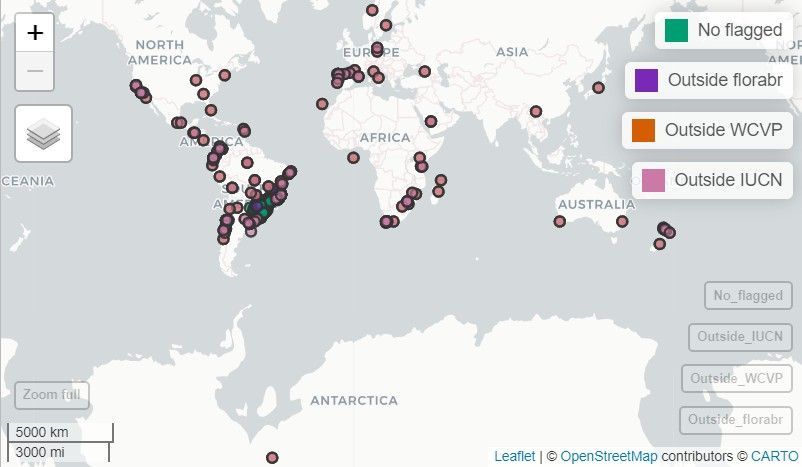
RuHere v1.0.1: Automatically flags common spatial errors in biological data using metadata, a six stage workflow, and functions that specifically integrate specialist-curated range information to identify geographic errors and introductions that often escape standard automated validation procedures. For details on the methodology see Trindade & Caron (2026). There are five vignettes including Reducing sampling bias and Ensuring spatial consistency.
Buddhism
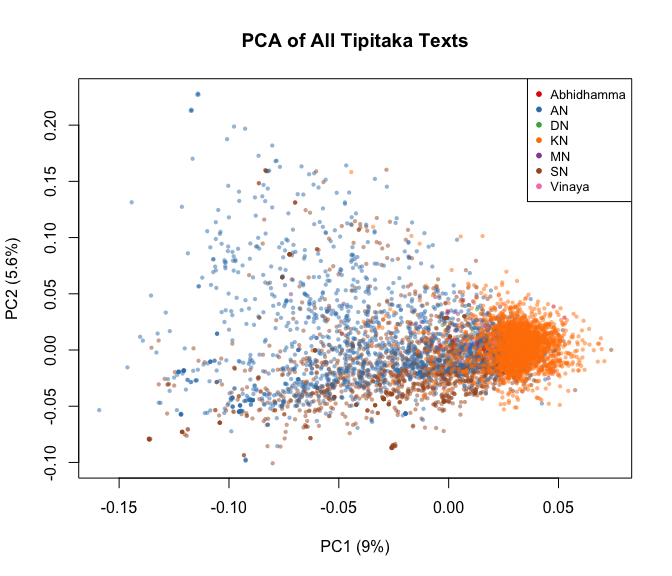
tipitaka.critical v1.0.0: A lemmatized critical edition of the complete Pali Canon (Tipitaka), the canonical scripture of Theravadin Buddhism. Based on a five-witness collation of the Pali Text Society edition via GRETIL, SuttaCentral, the Vipassana Research Institute Chattha Sangayana edition, the Buddha Jayanti Tipitaka, and the Thai Royal Edition. All text is lemmatized using the Digital Pali Dictionary, grouping inflected forms by dictionary headword. Covers all three pitakas, Sutta, Vinaya, Abhidhamma, with 5,777 individual text units. For background on the collation method, see Zigmond (2026) and the vignette.
Climate Science
tidyextreme v1.00: Provides functions to calculate Expert Team on Climate Change Detection and Indices from daily or hourly temperature and precipitation data along with functions for flexible data handling. See the vignette.
Computational Methods
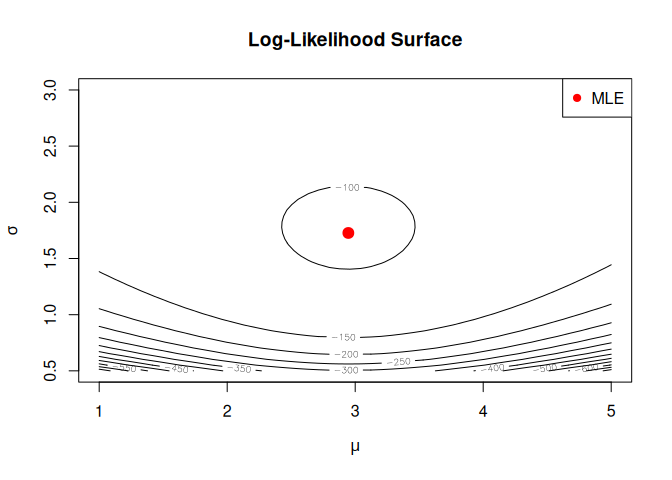
compositional.mle v2.0.0: Provides composable optimization strategies for maximum likelihood estimation. Solvers are first-class functions that combine via sequential chaining, parallel racing, and random restarts. Implements gradient ascent, Newton-Raphson, quasi-Newton (BFGS), and derivative-free methods with support for constrained optimization and tracing. Returns mle objects compatible with algebraic.mle for downstream analysis. Methods are based on Nocedal J, Wright SJ (2006). There are five vignettes including Getting Started and Theory and Intuition Behind Numerical MLE.
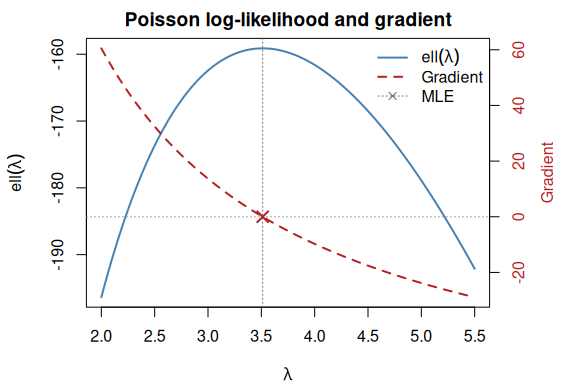
nabla v0.7.1: Enables exact automatic differentiation for R functions and provides a composable derivative operator D that computes gradients, Hessians, Jacobians, and arbitrary-order derivative tensors at machine precision. D(D(f)) gives Hessians, D(D(D(f))) gives third-order tensors for skewness of maximum likelihood estimators, and so on to any order. Works through any R code including loops, branches, and control flow. There are five vignettes including an Introduction and Gradient andHessian Computation.
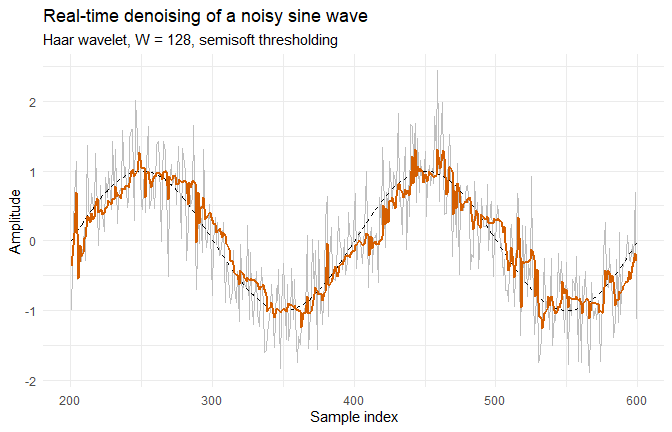
rLifting v0.9.0: Performs Wavelet Lifting Transforms focusing on signal denoising and functional data analysis (FDA). Implements a hybrid architecture with a zero-allocation C++ core for high-performance processing. Features include unified offline (batch) denoising, causal, real-time filtering using a ring buffer engine, and adaptive recursive thresholding. There are five vignettes including an Introduction and Real-time signal smoothing.
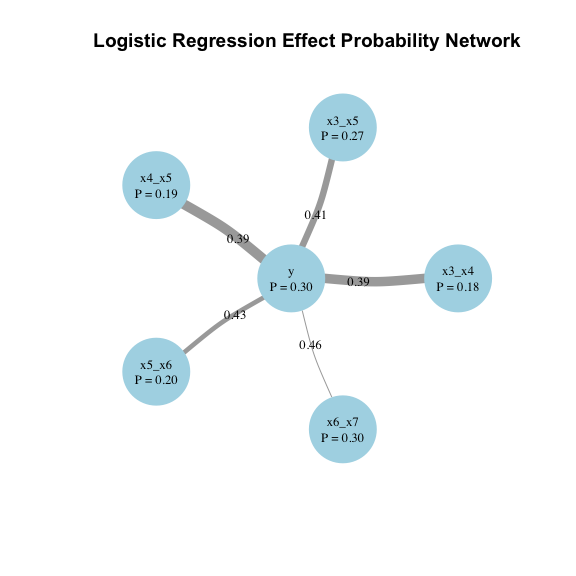
setweaver v1.0.0: Create sets of variables based on a mutual information. In this context, a set is a collection of distinct elements (e.g., variables) that can also be treated as a single entity. Mutual information, quantifies the dependence between two variables by expressing how much information about one variable can be gained from observing the other. See the vignette.
Data
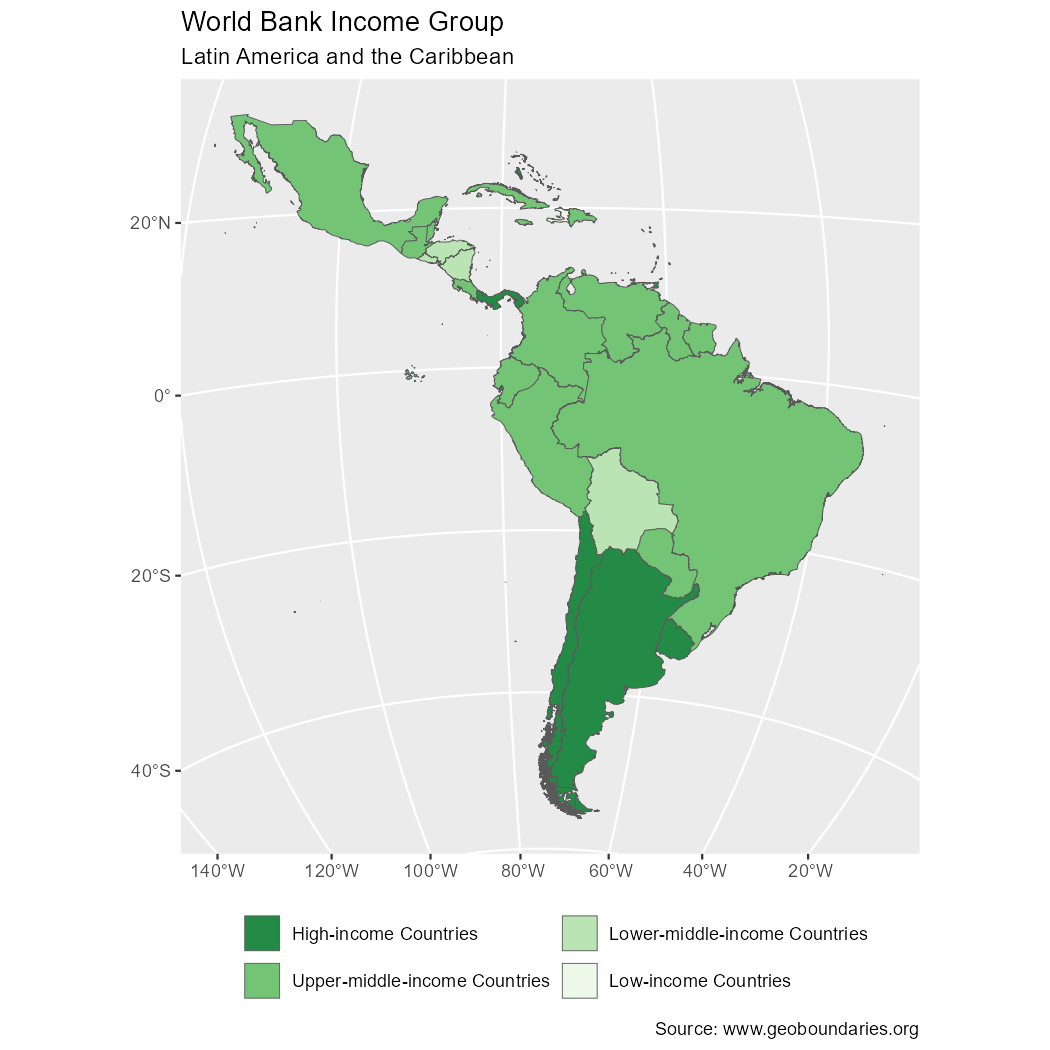
geobounds v0.1.1: Provides tools for downloading data from geoBoundaries. Several administration levels are available. See Runfola, D. et al. (2020) for background and the vignette for examples.
healthbR v0.2.0: Provides easy access to Brazilian public health data from multiple sources including VIGITEL (Surveillance of Risk Factors for Chronic Diseases by Telephone Survey), PNS (National Health Survey), PNAD Continua (Continuous National Household Sample Survey), POF (Household Budget Survey with food security and consumption data), Censo Demografico (population denominators), SIM (Mortality Information System), SINASC (Live Birth Information System) and several other repositories. Data is downloaded from the Brazilian Ministry of Health and is returned in tidy format following tidyverse conventions. There are seventeen vignettes including an Introduction and Chronic Disease Risk Factors.
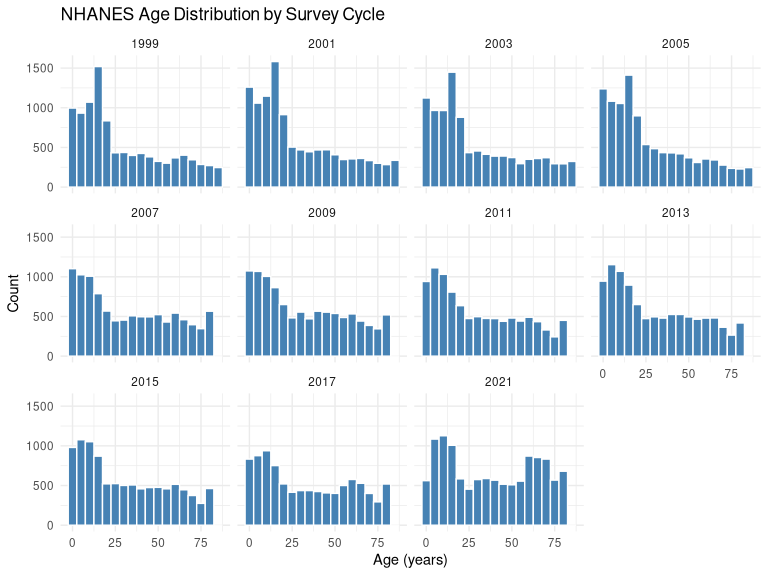
nhanesdata v4.1.0: Instant access to harmonized National Health and Nutrition Examination Survey NHANES data spanning 1999-2023. Retrieve pre-processed datasets from reliable cloud storage with automatic type reconciliation and integrated search tools for variables and datasets. Simplifies NHANES data workflows by handling cycle management and maintaining data consistency across survey waves. There are four vignettes including Getting Started and Available NAHANES Datasets.
roadDB v1.1.0: Provides interface to the ROCEEH Out of Africa Database (ROAD), a comprehensive resource for archaeological, anthropological, paleoenvironmental and geographic data from Africa and Eurasia dating from 3,000,000 to 20,000 years BP. Users can retrieve data from the online database at different levels of detail and customize search requests. See README to get started.
Ecology
spacemodR v0.1.3: Provides tools for modeling food web transfer based on an initial ground raster. It provides a directed acyclic graph structure for a set of rasters representing the flow of elements (e.g., food, energy, contaminants). It also includes tools for working with dispersal algorithms, enabling the combination of flux data with population movement. See the tutorial.
Epidemiology
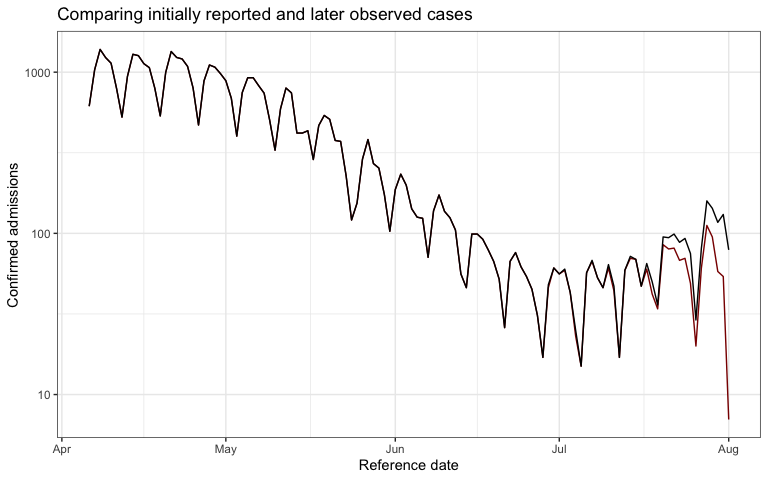
baselinenowcast v0.2.0: Provides nowcasting methods based on using empirical delay distributions and uncertainty from past performance as well as a baseline method for developers of new nowcasting methods. The package supports standard data frame inputs as well as the direct use of reporting triangles, and is compatible with epinowcast objects and accommodates a wide spectrum of reporting schedules, including mixed patterns of reference and reporting (daily-weekly, weekly-daily). For background see Johnson et al. (2026). There are five vignettes including Getting Started and Mathematical Methods.
multigroup.vaccine v0.1.1: Provides functions for modeling infectious disease dynamics in populations with multiple subgroups having different vaccination rates, transmission characteristics, and contact patterns. Enables calculating outbreak sizes, automatically fetching U.S. census data, and exploring vaccination scenarios with an interactive shiny dashboard. See Nguyen et al. (2024) and Duong et al. (2026) for background. There are four vignettes including Getting Started and Measles Age-Structured Model.
ViroReportR v1.0.4: Implements tools for reporting and forecasting viral respiratory infections, using case surveillance data. Report generation tools for short-term forecasts, and validation metrics for an arbitrary number of customizable respiratory viruses. Estimation of the effective reproduction number is based on the EpiEstim framework described in work by Cori et al. (2013). See the vignette.
Genomics
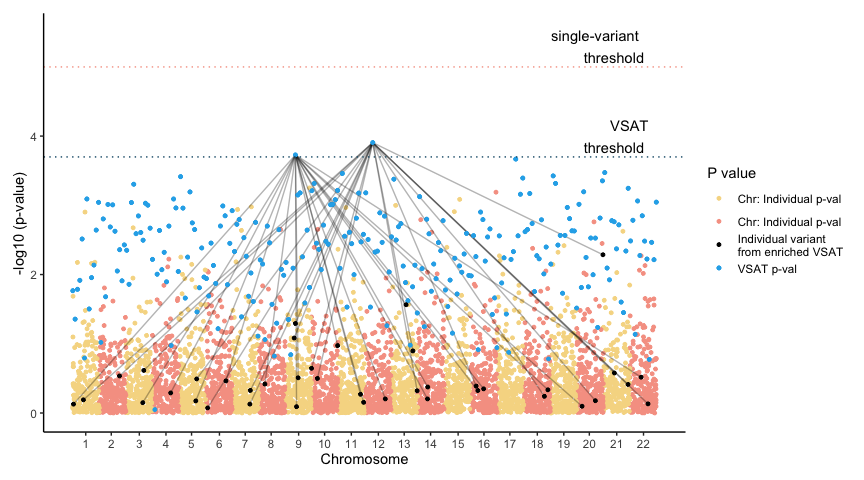
archipelago v0.1.0: Provides a graphical method for joint visualization of Variant Set Association Test results and individual variant association statistics. The Archipelago method assigns genomic coordinates to variant set statistics, allowing simultaneous display of variant-level and set-level signals in a unified plot supporting interpretation of both collective and individual variant contributions. For more see Lawless et al. (2026) and the vignette.
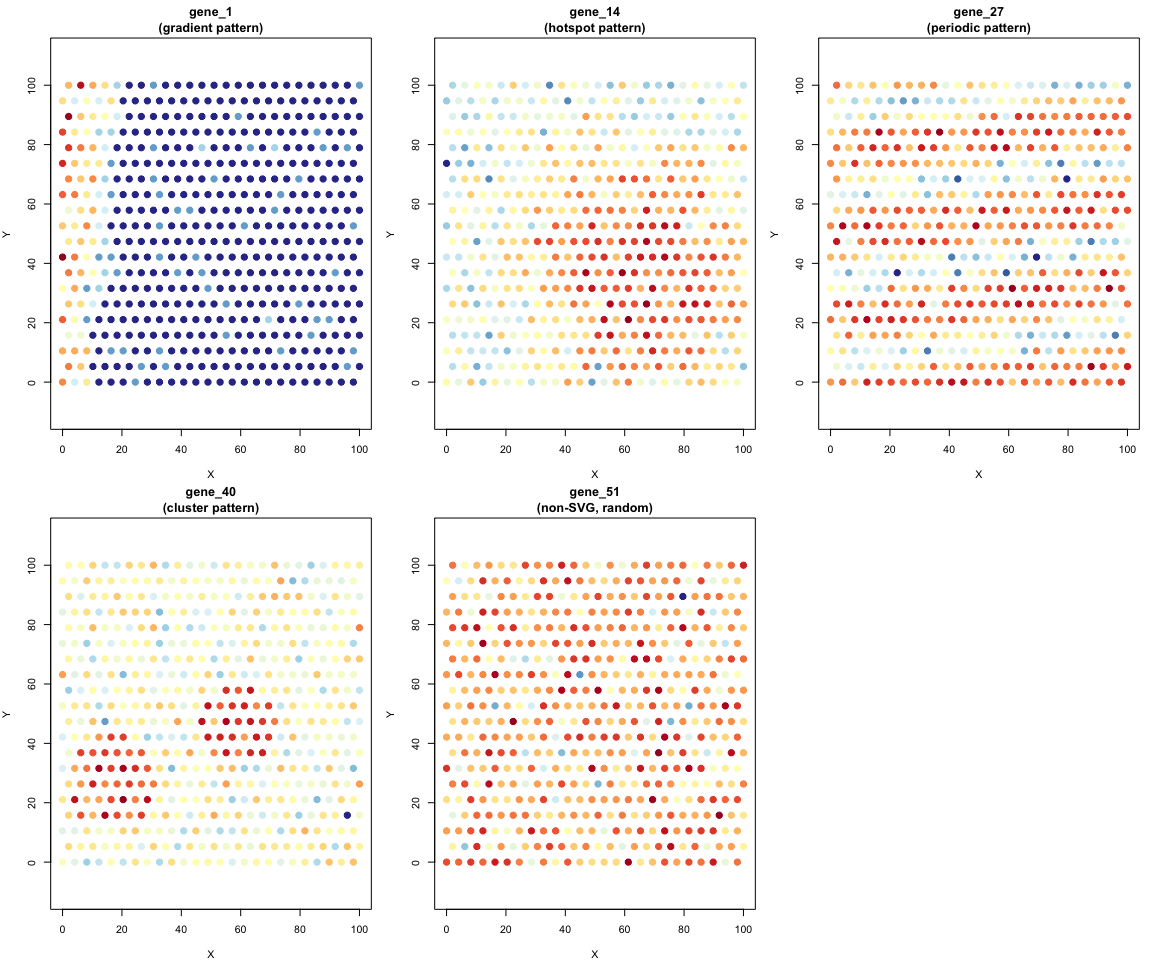
SVG v1.0.0: Implements a unified framework for detecting spatially variable genes in spatial transcriptomics data. SVG detection methods including MERINGUE (Moran’s I based spatial autocorrelation), Giotto binSpect (binary spatial enrichment test), SPARK-X (non-parametric kernel-based test), and nnSVG (nearest-neighbor Gaussian processes) which are described in Miller et al. (2021), Dries et al. (2021), Zhu et al. (2021), and Weber et al. (2023). See the vignette for examples.
Machine Learning
nadir v0.0.1: Provides a functional programming implementation of the super learner algorithm, van der Laan et al. (2007), with an emphasis on supporting the use of formulas to specify learners. Includes the ability to use random-effects specified in formulas e.g. (y ~ (age | strata) + …) and to construct new learners by passing a functions. See the vignette for basic examples.
Medical Applications
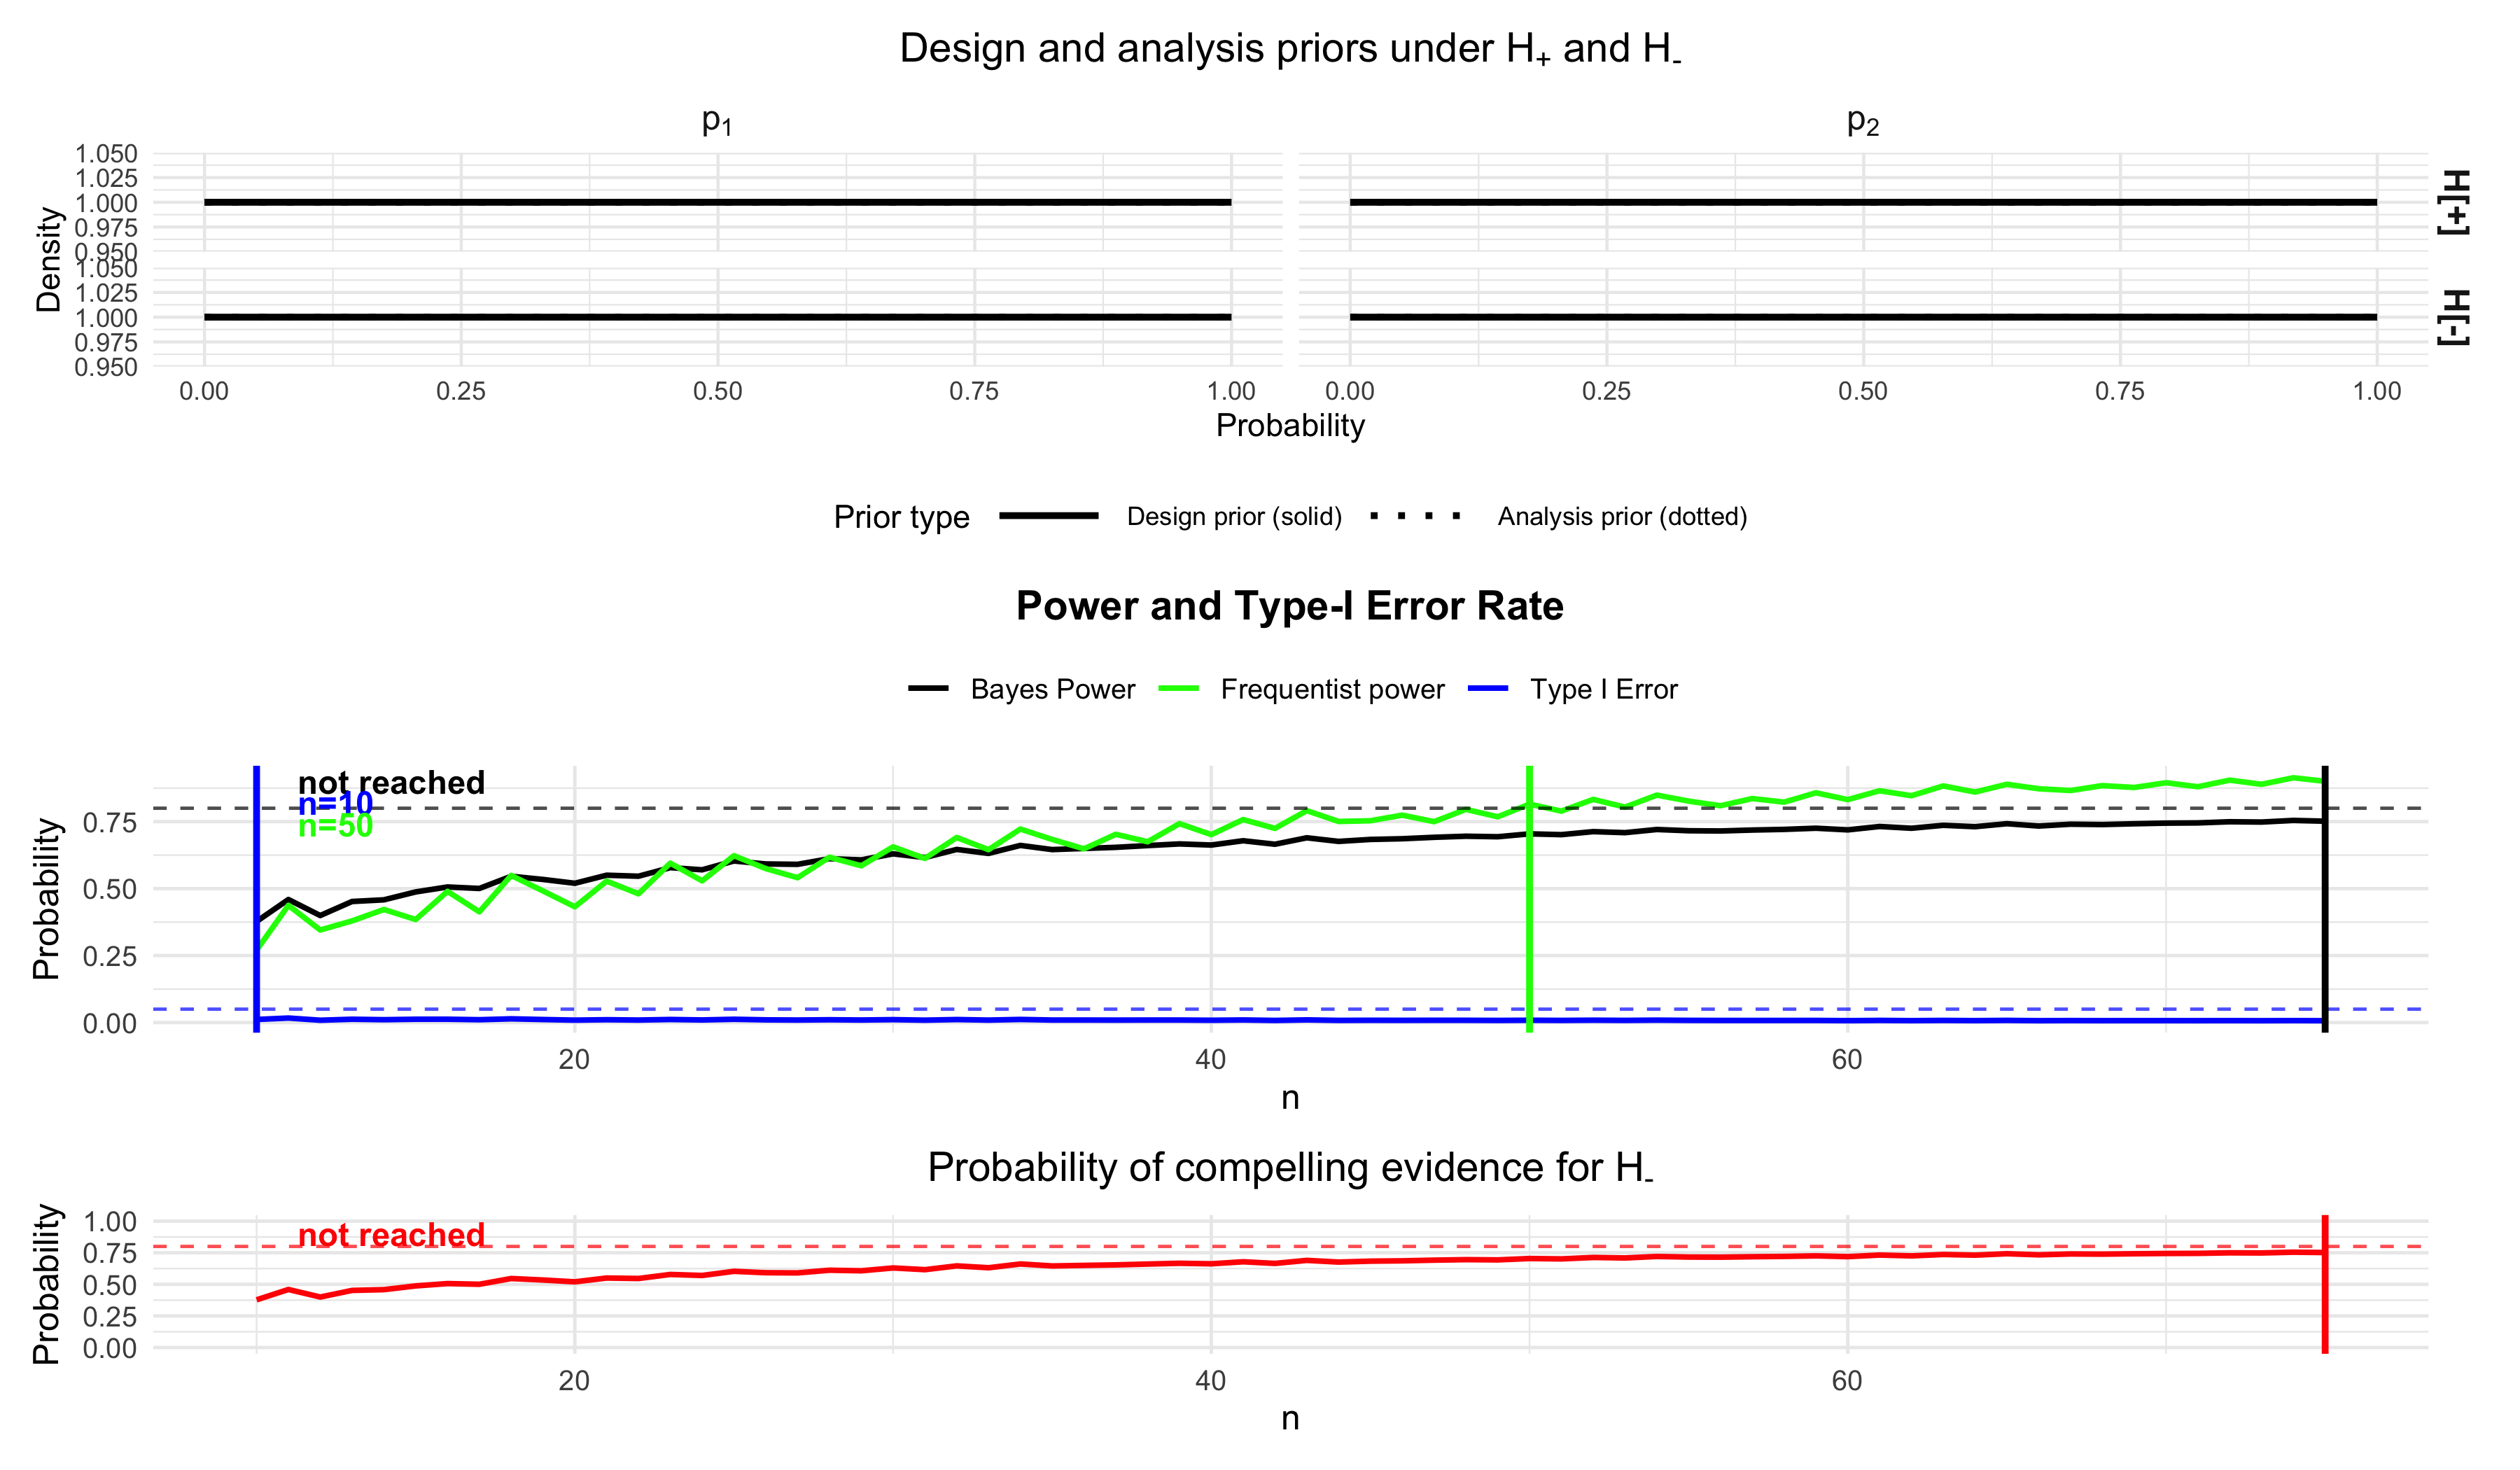
bfbin2arm v0.1.0: Provides tools to design and analyze two-arm binomial clinical (phase II) trials using Bayes factors. Implements Bayes factors for point-null and directional hypotheses, predictive densities under different hypotheses, and power and sample size calibration with optional frequentist type-I error and power. See the vignette.
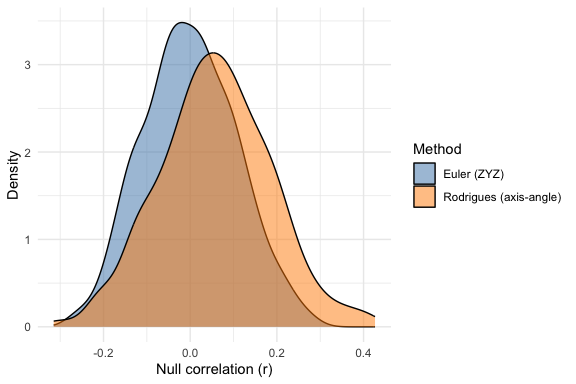
neuromapr v0.2.1: Implements spatial null models and coordinate-space transformations for statistical comparison of brain maps, following the framework described in Markello et al. (2022). Provides variogram-matching surrogates, Moran spectral randomization, and spin-based permutation tests. Includes an R interface to the neuromaps annotation registry for browsing, downloading, and comparing brain map annotations from the Open Science Framework. There are five vignettes including Getting Started and Surface Geometry.
Physics
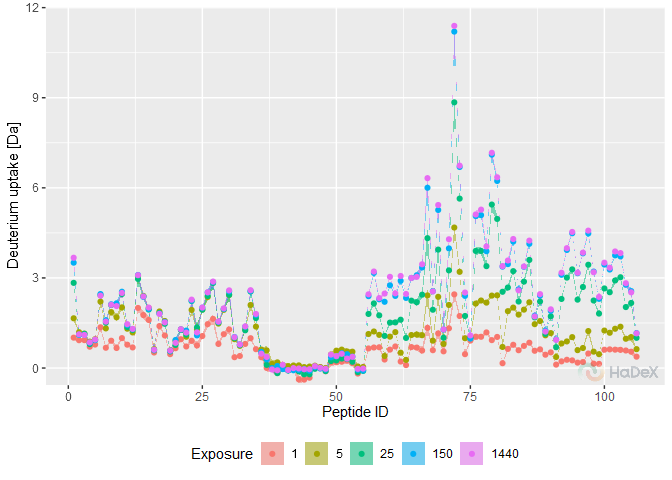
HaDeX2 v1.0.0: Process, analyze and visualize Hydrogen Deuterium eXchange monitored by Mass Spectrometry experiments (HDX-MS) via a new reproducible workflow for the analysis of the HDX-MS data that includes uncertainty propagation, data aggregation and visualization on 3D structure, functions for data exploration, quality control and generation of publication-quality figures and a companion Shiny application. There are eleven vignettes including Calculations and Data Visualization.
Statistics
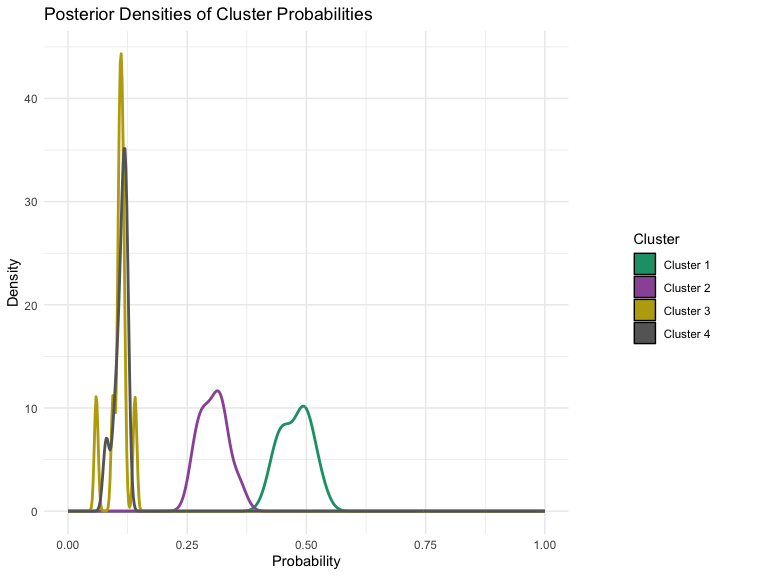
BCFM v1.0.0: Implements the Bayesian Clustering Factor Models for simultaneous clustering and latent factor analysis of multivariate longitudinal data. The model accounts for within-cluster dependence through shared latent factors while allowing heterogeneity across clusters, enabling flexible covariance modeling in high-dimensional settings. The methodology is described in Shin, Ferreira, and Tegge (2018). See the vignette for examples.
clmstan v0.1.1: Provides functions to fit cumulative link models for ordinal categorical data using CmdStanR. Supports various link functions including logit, probit, cloglog, loglog, cauchit, and flexible parametric links such as Generalized Extreme Value, Asymmetric Exponential Power, and Symmetric Power. Methods are described in Agresti (2010), Wang and Dey (2011), and Naranjo, Perez, and Martin (2015). See the vignette to get started.
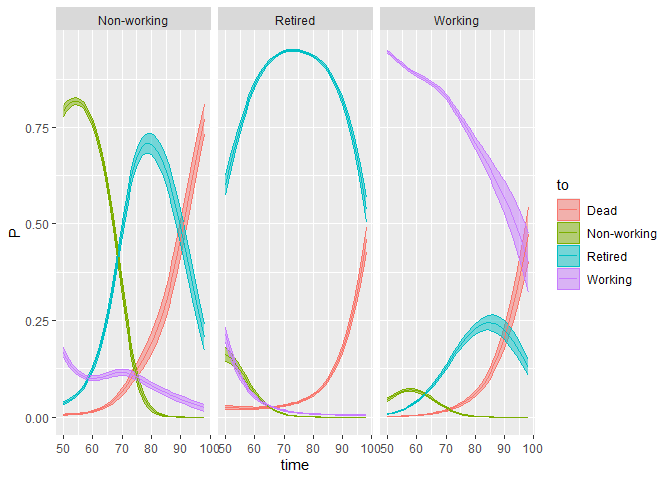
dtms v0.4.2: Implements discrete-time multistate models, several ways of estimating parametric and nonparametric multistate models, and an extensive set of Markov chain methods which use transition probabilities derived from the multistate model. See Schneider et al. (2024), Dudel (2021), Dudel & Myrskylä (2020), and van den Hout (2017) for background and README to get started.
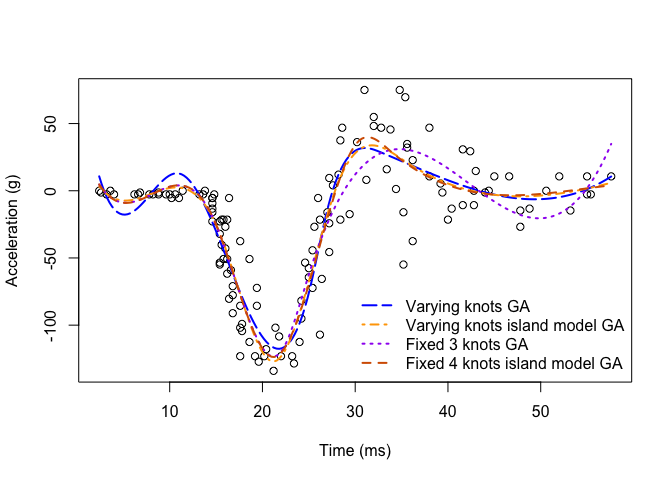
GAReg v0.1.0: Provides a genetic algorithm framework for regression problems requiring discrete optimization over model spaces with unknown or varying dimension, where gradient-based methods and exhaustive enumeration are impractical. The computation is built on the GA engine of Scrucca (2017), and changepointGA engine from Li and Lu (2024). In challenging high-dimensional settings, functions enable efficient search and delivers near-optimal solutions. See the vignette.
mixpower v0.1.0: Implements a simulation-based toolkit for power and sample-size analysis for linear and generalized linear mixed-effects models (LMMs and GLMMs). Supports Gaussian, binomial, Poisson, and negative binomial families via lme4; Wald and likelihood-ratio tests; multi-parameter sensitivity grids; power curves and minimum sample-size solvers; parallel evaluation with deterministic seeds; and functions for reproducibility. Run time diagnostics include failure rate, singular-fit rate, effective N and publication-ready summary tables. There are five brief vignettes including an Introduction and Running simulations.
rblimp v1.0.: Provides an interface to Blimp software for Bayesian latent variable modeling, missing data analysis, and multiple imputation. The package generates Blimp syntax, executes Blimp models, and imports results back into R as structured objects with methods for visualization and analysis. See README to get started.
rareflow v0.1.0: Provides variational flow-based methods for modeling rare events using Kullback–Leibler divergence, normalizing flows, Girsanov change of measure, and Freidlin–Wentzell action functionals and tools for rare-event inference, minimum-action paths, and quasi-potential computation in stochastic dynamical systems. Methods are based on Rezende and Mohamed (2015), Girsanov (1960), and Freidlin and Wentzell (2012). See the vignette.
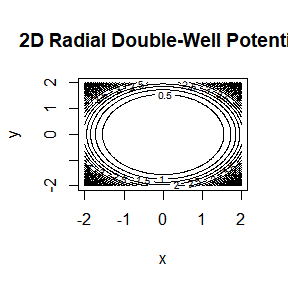
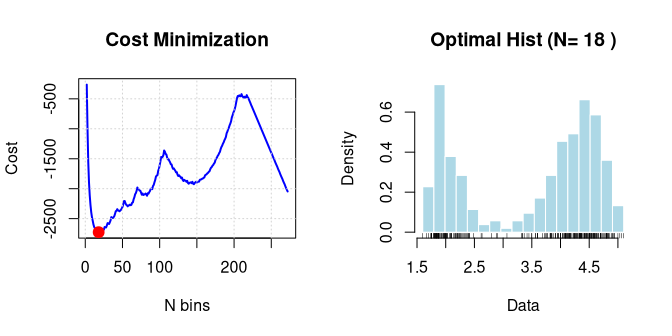
sshist v0.1.3: Implements the Shimazaki-Shinomoto method for optimizing the bin width of a histogram. This method minimizes the mean integrated squared error and features a C++ backend for high performance and shift-averaging to remove edge-position bias. Ideally suited for time-dependent rate estimation and identifying intrinsic data structures. Supports both 1D and 2D data distributions. See Shimazaki and Shinomoto (2007) for more details and the vignette for an introduction.
Surveys
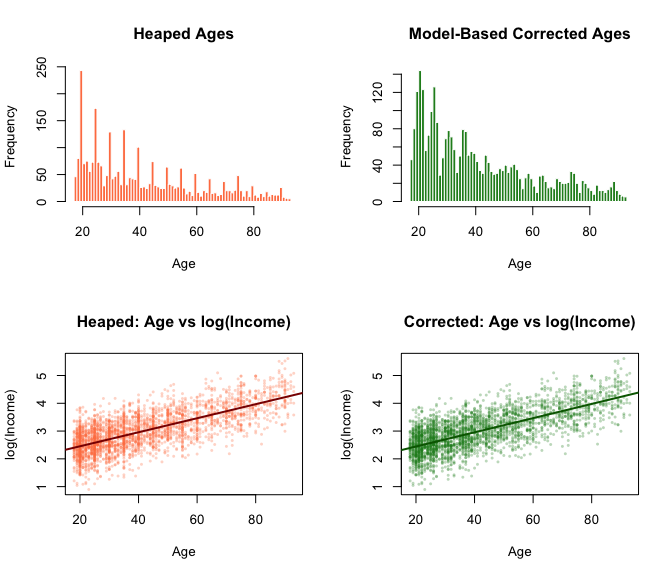
heaping v0.1.0: Provides methods for correcting heaping (digit preference) in survey data at the individual record level. Age heaping, where respondents disproportionately report ages ending in 0 or 5, is a common phenomenon that can distort demographic analyses. Unlike traditional smoothing methods that only correct aggregated statistics, this package corrects individual values by replacing a calculated proportion of heaped observations with draws from fitted truncated distributions. See the vignette.
metasurvey v0.0.21: Provides a step-based pipeline for reproducible survey data processing, building on the survey package for complex sampling designs. Supports rotating panels with bootstrap replicate weights, and provides a recipe system for sharing and reproducing data transformation workflows across survey editions. There are thirteen vignettes including Getting Started and Survey design and Validation.
Time Series
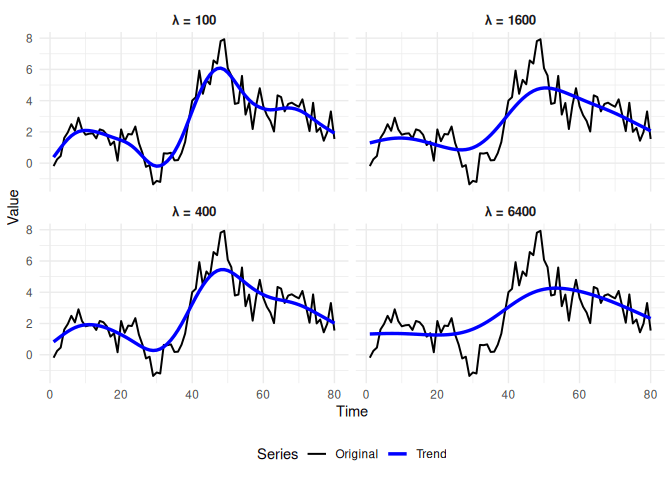
mhpfilter v0.1.0: Implements the Modified Hodrick-Prescott Filter for decomposing macroeconomic time series into trend and cyclical components via efficient C++ routines. Unlike the standard HP filter, functions estimate series-specific lambda values that minimize the GCV criterion. See Choudhary, Hanif and Iqbal (2014), and Coe and McDermott (1997) for background. There is an Introduction and a vignette on Modified HP Filter Theory.
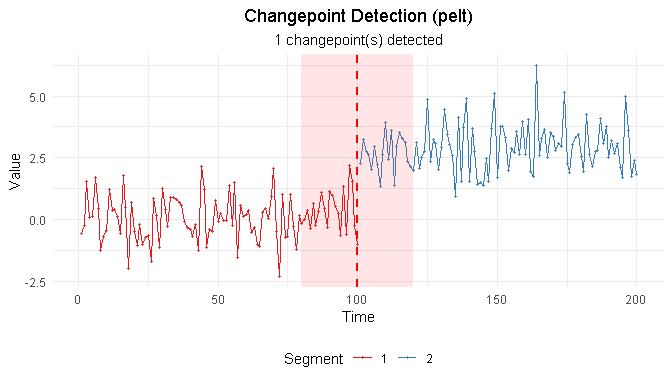
RegimeChange v0.1.1: Implements a unified framework for detecting regime changes (changepoints) in time series data that includes both frequentist and Bayesian methods for univariate and multivariate series with detection of changes in mean, variance, trend, and distributional properties. See Page (1954), Killick, Fearnhead, and Eckley (2012) for frequentist methods and Adams and MacKay (2007). for Bayesian methods. There are three vignettes including and Introduction and Bayesian Changepoint Detection.
Utilities
birddog v1.0.0: Provides a unified set of methods to detect scientific emergence and technological trajectories in academic papers and patents by combining citation network analysis with community detection and attribute extraction, also applying natural language processing and structural topic modeling to uncover the contents of research communities. Applications of the method include: Souza et al. (2022) and Maria et al. (2023). See README for the methodology and look here for an introduction and examples.

phinterval v1.0.0: Implements the phinterval vector class for representing time spans that may contain gaps (disjoint intervals) or be empty. This class generalizes the lubridate package’s interval class to support vectorized set operations (intersection, union, difference, complement) that always return a valid time span, even when disjoint or empty intervals are created. See the vignette.
Visualization
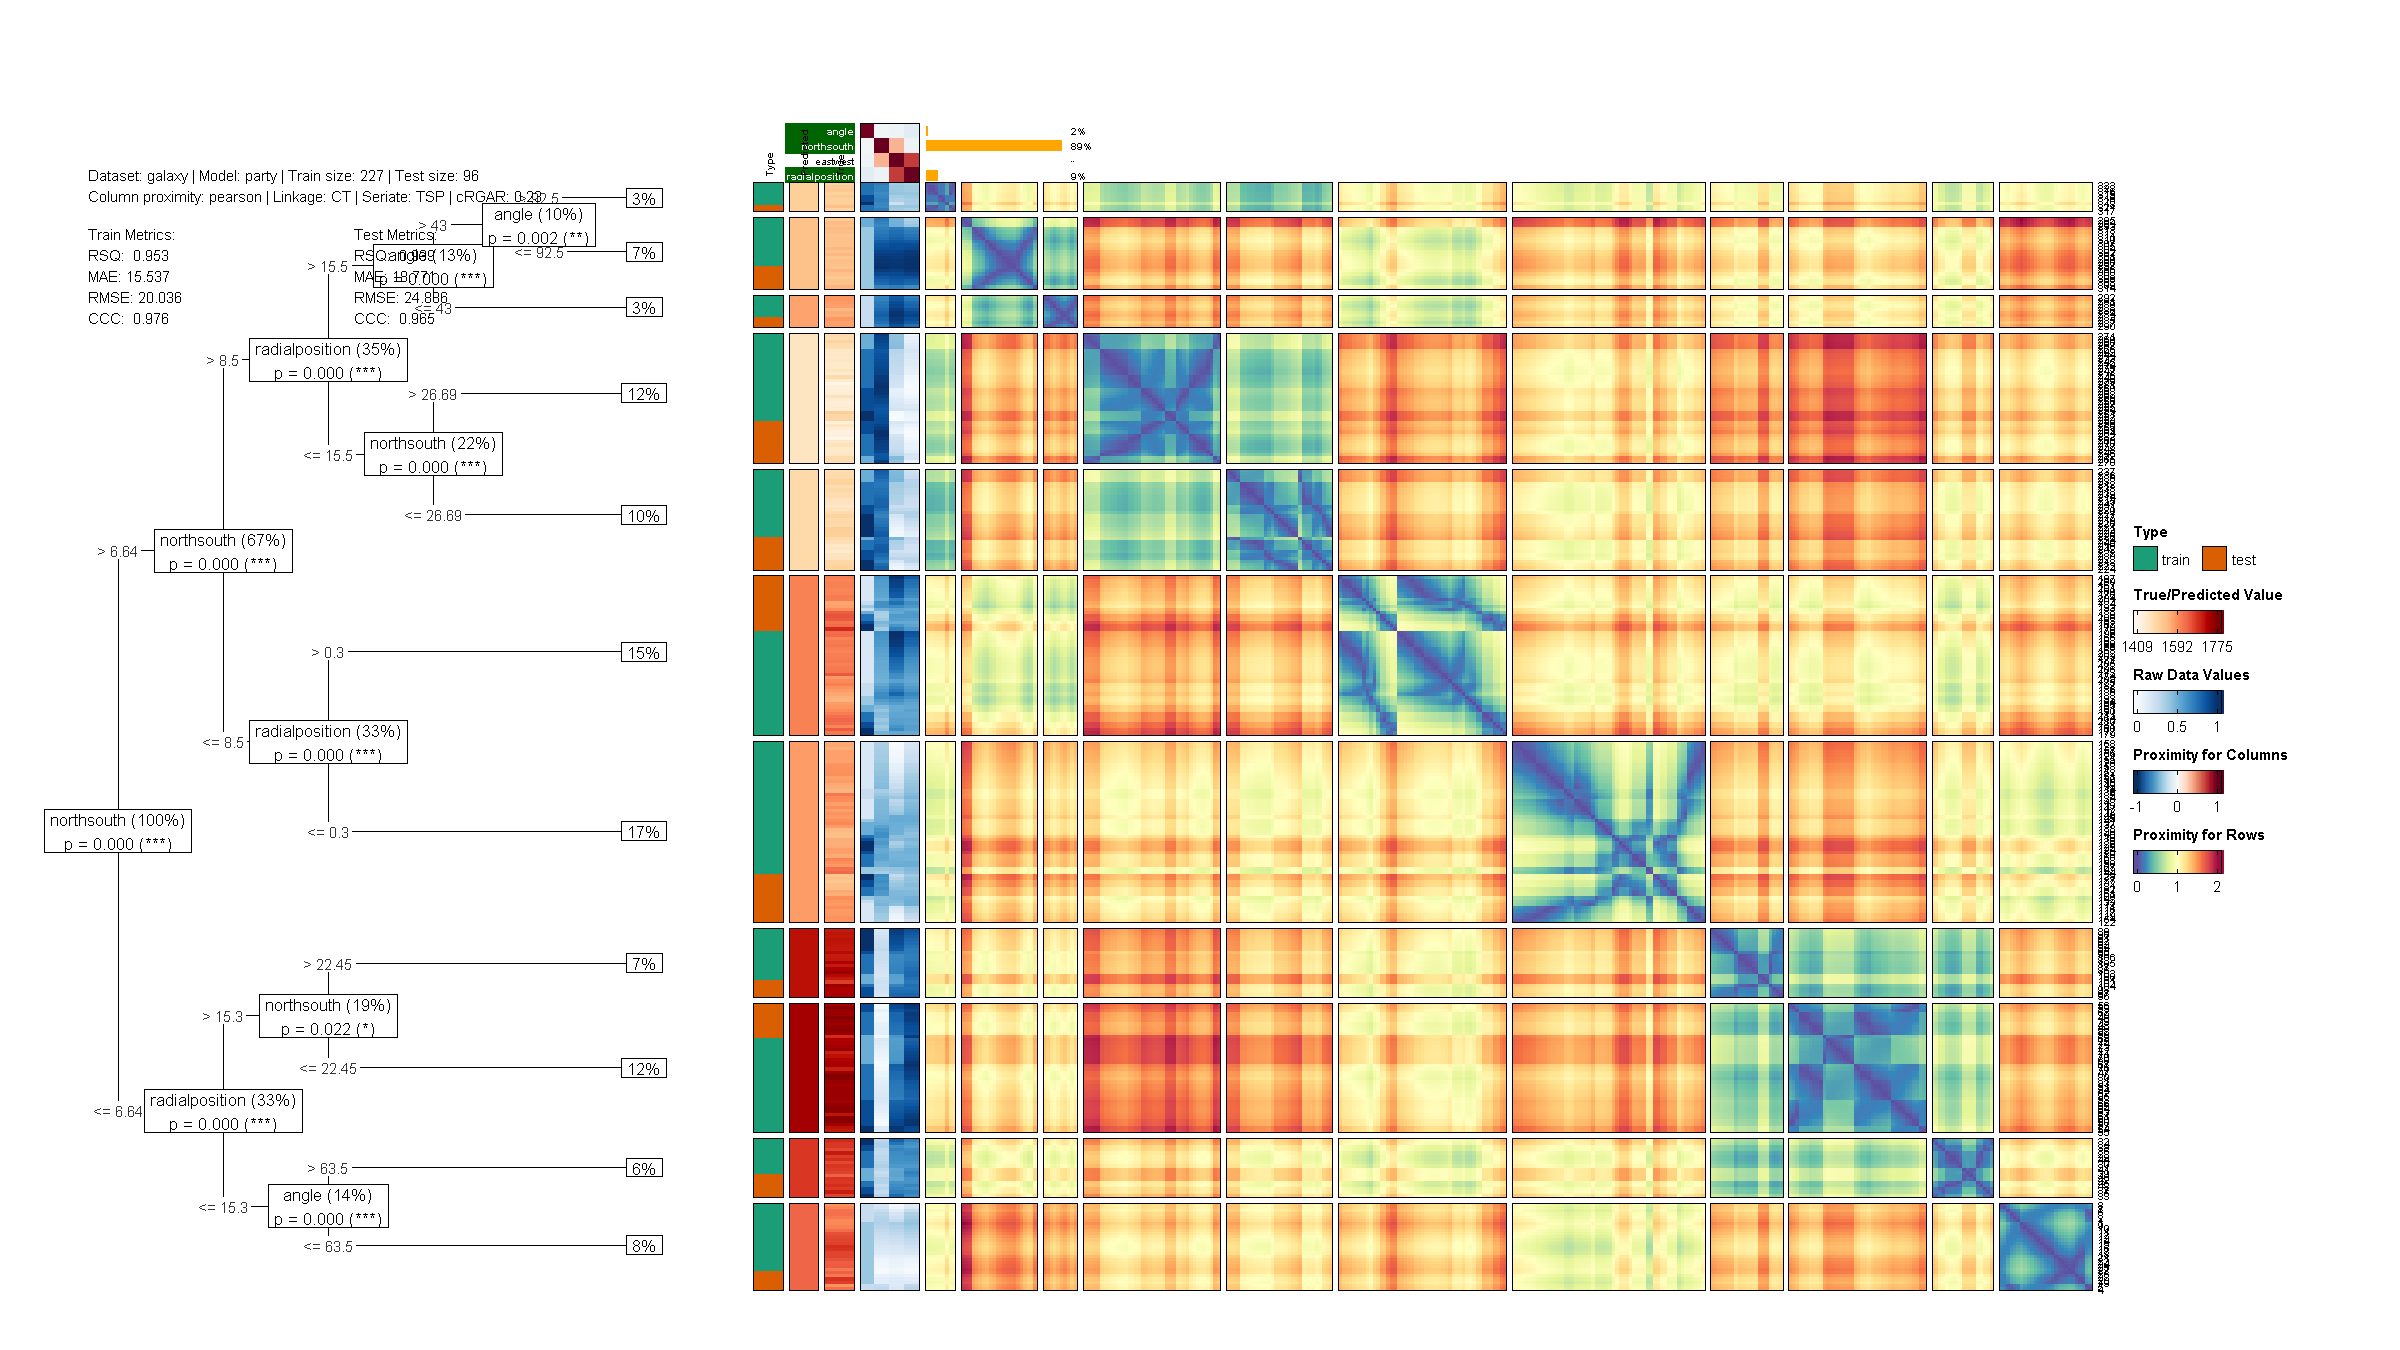
dtGAP v0.0.2: Provides supervised generalized association plots based on decision trees and enhances decision tree visualization by incorporating Generalized Association Plots through matrix-based visualizations including confusion matrix maps, decision tree matrix maps, and predicted class membership maps. See README.
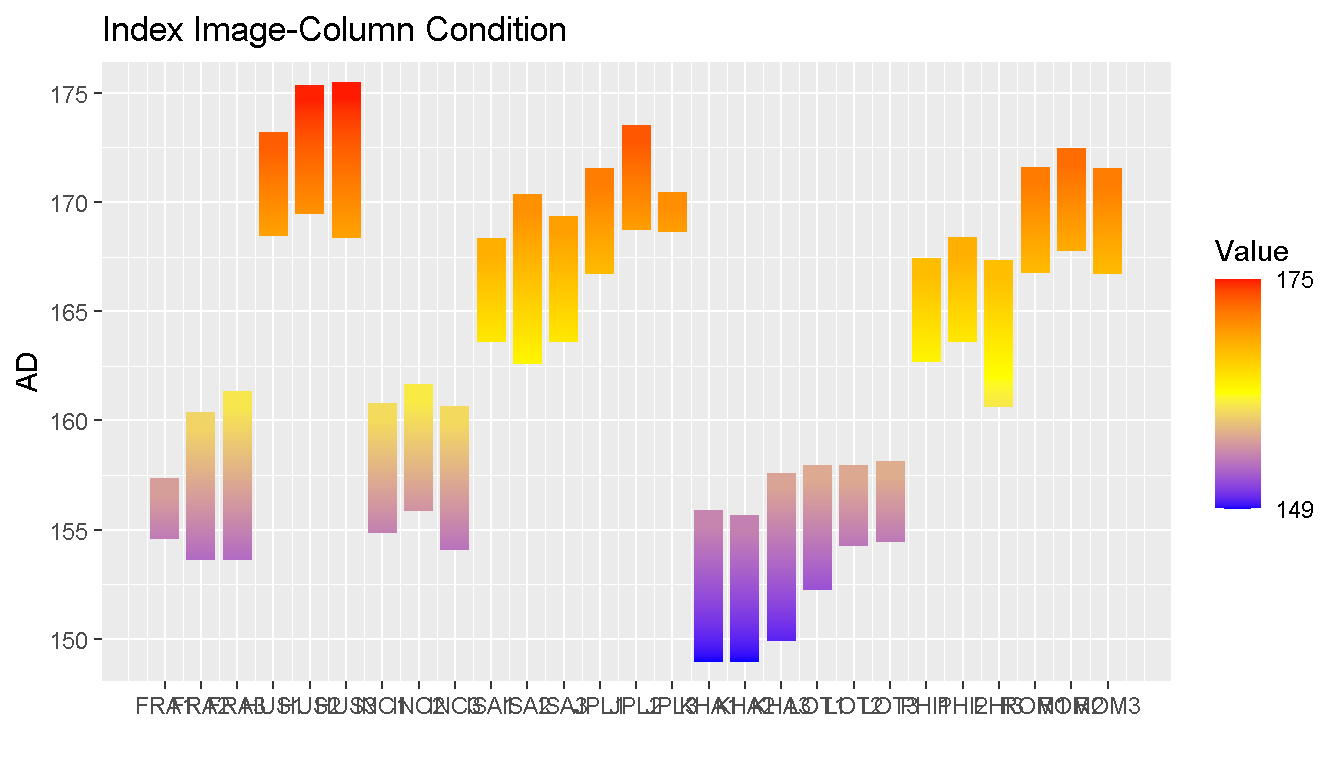
ggInterval v0.2.4: Extends ggplot2 to visualize symbolic interval-valued data with various plots via more general and flexible input arguments, and provides a function to transform classical data into symbolic data using both clustering algorithms and customized methods. See the vignette.
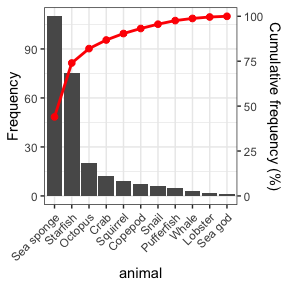
nomiShape v1.0.1: Provides tools for visualizing and analyzing the shape of discrete nominal frequency distributions and introduces centered frequency plots, in which nominal categories are ordered from the most frequent category at the center toward less frequent categories on both sides, facilitating the detection of distributional patterns such as uniformity, dominance, symmetry, skewness, and long-tail behavior. In addition, the package supports Pareto charts for the study of dominance and cumulative frequency structure in nominal data. There are twelve vignettes including Visualizing and Analyzing Distributions of Nominal Variables and Pareto Plots for Nominal Distributions.